Received: Mon 19, Feb 2024
Accepted: Mon 18, Mar 2024
Abstract
The electrophysiological technique of auditory steady state responses (ASSR) makes possible objective hearing threshold definition, with frequency specificity. A high level of reliability is a basic requirement for applying this technique in a medicolegal context. 35 subjects affected by significant occupational noise induced hearing loss and claiming compensation underwent a thorough medical and audiological examination, including an analysis of the auditory steady state responses (ASSR) in order to objectively define hearing thresholds with frequency specificity, and ear-by-ear. In order to investigate the reproducibility of the thresholds obtained by this technique, the electrophysiological exploration was repeated immediately after the first test. An exhaustive statistical comparison of the results rejects the hypothesis of any significant difference between the results of both exams, whatever severity of hearing loss and frequency. All correlation coefficients (R and ICC) and Cronbach’s α values reach or exceed 0.9. Bland-Altman plots rule out systematic shifts, as well as proportional errors, or variations that depends on the magnitude of the measurements.
Keywords
ASSR, reliability, medicolegal, NIHL, occupational
1. Introduction
Within the scope of insurance medicine, compensation is a major issue, and needs to rely upon a valid quantification of physical impairment or working incapacity. When occupational NIHL (noise induced hearing loss) is concerned, suspicious audiometric findings are not uncommon in a medicolegal context; in the case of an insurance system with compensation for occupational diseases, the prospect of financial advantages may incite to either deliberately exaggerate hearing impairment or possibly unconsciously raise response criteria [1, 2]. Specific requirements of hearing assessment in medicolegal context are: validity and reliability of threshold values, frequency specificity, non-invasiveness and good tolerance on the part of the subject being examined, and low sensitivity to (sedative) drugs. In case traditional methods of behavioral audiometry lack reliability, and consequently an objective electrophysiological approach is needed, the technique of auditory steady state responses (ASSRs) has proven to be adequate [1, 2]. Auditory steady state responses (ASSRs) are electrophysiological responses to auditory stimuli presented at rates between 1 and 200 Hz or by periodic modulations (at similar rates) of the amplitude and/or frequency of a continuous (‘steady state’) tone. This tone is characterized by a specific frequency, the so-called carrying frequency (CF). It is possible to record auditory steady-state responses from electrodes on the scalp. The EEG signal is amplified about 80.000 times and a bandpass of 5-100 Hz is applied for filtering.
The ASSR is occurring at the same rate as the modulation frequency, hence it is suited for analysis by frequency-domain methods. The spectrogram of the response will reveal a peak at the modulation frequency [3]. The evidence of an ASSR depends on the proper functioning of both the auditory peripheral structures (cochlea, auditory nerve) for the CF, and the central auditory pathways [3]. A key-issue, particularly in a medicolegal context, is the optimal test-retest reproducibility of the results, i.e. the electro-physiologically defined thresholds. This has been checked in limited series of subjects with normal hearing [4-6], and in a small series (14) of hearing-impaired subjects [5]. However, the hearing impairment in these subjects was limited (38.7 dB), and was not noise-induced. In the framework of insurance medicine, further validation is imperatively required for compensation claimants with specific NIHL, and levels of hearing loss that fall within the range of compensable damage, i.e. at least 50 dB. The present prospective study investigates the test-retest reproducibility of air conduction ASSR thresholds across two consecutive sessions in subjects with significant occupational NIHL, and claiming for compensation.
2. Material & Methods
2.1. Subjects
Subjects were 35 successive claimants (34 males, 1 female: aged 60.45 +/- 8.69 years) for compensation of occupational NIHL at FEDRIS, the Federal Agency for Occupational Risks (Brussels, Belgium). Prior to medical and audiological examination, the occupational career of each subject was checked by a specialized engineer for noise exposure (level exceeding 85 dBA for > 1 year: time weighted average, i.e. LEX,8h = or > 85 dBA). The basic inclusion criterion for deciding to perform an electrophysiological exam is a PTA that reveals - during the medical-forensic expert assessment at FEDRIS - pejorative thresholds (average 1-2-3 kHz) with respect to the audiogram provided by the claimant together with his/her application form for justifying the claim [2, 3]. The underlying rationale is that the PTA at FEDRIS is performed in optimal conditions, i.e. with regularly calibrated clinical audiometers, a large soundproof double-walled booth designed for evoked potentials, by a team of highly experienced audiologists and with the possibility of several test-retests without any time constraint. Furthermore, in the vast majority of cases, a significant temporary threshold shift (TTS) is practically ruled out, as the time interval since the last potential exposure to occupational noise always exceeds 15 h. The common rule is that the PTA-thresholds measured at FEDRIS are found slightly lower (better) than those obtained either in an environment of occupational medicine, or in an ENT-outpatient clinic. If it is not the case, an additional objective electrophysiological test is performed.
For computation of physical impairment (and level of compensation), the Belgian guideline uses algorithms including the thresholds at 1, 2 and 3 kHz [1]. Lutman et al. [7] proposed to quantify noise-induced hearing loss based on hearing threshold levels averaged over the frequencies 1, 2 and 3 kHz, 3 KHz being preferred to 4 KHz as it contains more speech information than 4 kHz [8].
Exclusion criteria for this study were: abnormal otoscopy, air bone gap, history of ear pathology.
2.2. Material
ASSRs were obtained using a neuro-audio.net system from Neurosoft Ltd, Ivanovo. The stimuli are pure tones (0.5, 1, 2, and 4 kHz), with a 100% amplitude and a 10% frequency modulation, the modulation frequency being around 46 Hz. After the stimulation has started, the algorithm seeks for a significant response in each of the frequency channels. As soon as the level of significance is reached in one channel, the algorithm stops recording in that particular channel (e.g., 45 dB at 2 kHz left), while recording continues in the other channels. In the channel in which significance is reached, the stimulation automatically restarts with a 5 dB lower intensity, and the process is repeated until no significant response is obtained after 6 minutes. The time progress of the eight channels is permanently displayed, and the system also displays an ‘audiogram’ (Figures 1 & 2).
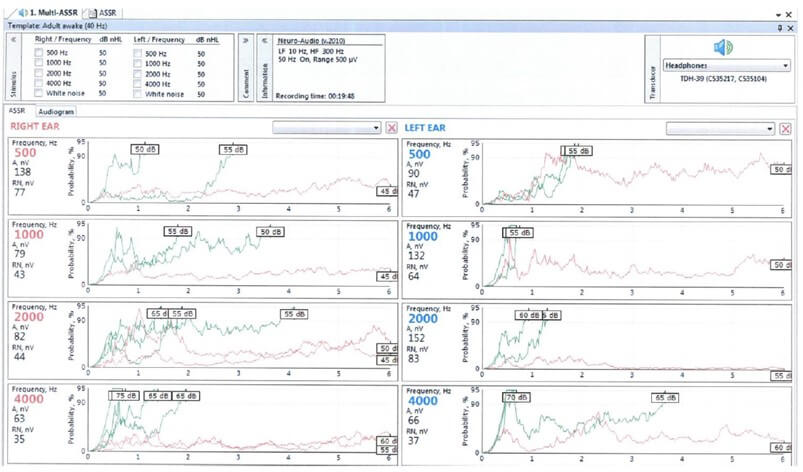
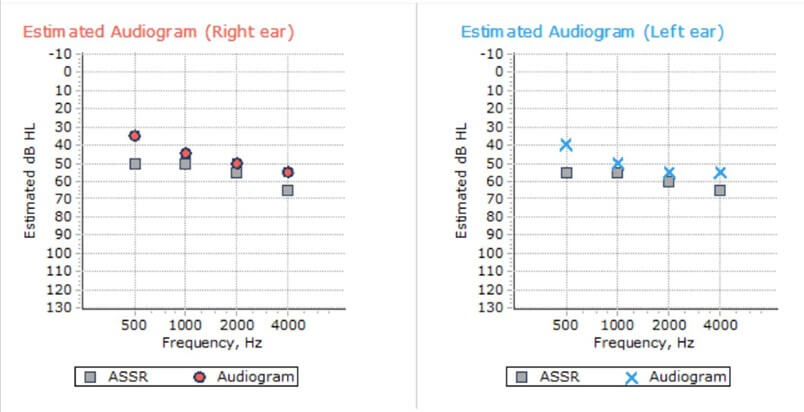
This process allows to avoid any subjective interpretation. Actually the software program also systematically and automatically indicates an ‘estimated threshold’ based on the ASSR response. In a previous article [2], using the same machine, we specified the correction factor applied by the manufacturer’s software: 1 kHz: up to 10 dB: no correction; from 15 up to 65 dB: + 5 dB; from 70 dB on: + 10 dB; 2 kHz: up to 15 dB: no correction; from 20 up to 55 dB: + 5 dB; from 60 dB on: + 10 dB; 4 kHz: from 20 dB on: + 10 dB. Considering the medicolegal purpose of this objective hearing assessment, only the true electrophysiological thresholds are taken into account. In each subject, the ASSR-test was performed two times consecutively, in order to investigate specifically the functioning of the device and its interaction with the subject and to rule out any other factor likely to modify the thresholds.
For electrophysiological testing, the subject was lying on an examination couch, in a relaxed position, with his head resting on a pillow, and remained awake for the total duration of the testing.
Conventional as well as electrophysiological audiometric procedures were carried out in a soundproof booth (background noise measured inside 27 dBA), also operating as a Faraday cage. Acoustic stimuli were provided to the subject via two TDH-39 headphones (Telephonics, Farmingdale, NY, USA).
In a few cases, no ASSR-threshold could be obtained. In such cases, thresholds were set at the highest value that could be measured by the device: i.e. 95 dB for 0.5 kHz and 105 dB for 1, 2 and 4 kHz.
2.3. Statistics
In the present study we focus on statistical comparisons between the hearing thresholds provided by two consecutive ASSR exams: hence we will consider the differences between the corresponding two variables (i.e. the thresholds at each frequency) of both exams (Student’s paired t-test) the strength of the relation between the two variables (the standard Pearson correlation coefficient R and the nonparametric Goodman and Kruskal's gamma [9]). Goodman and Kruskal's gamma is recommended when the data contain many tied ranks [10].
Cronbach’s α (also called reliability coefficient): a way of assessing reliability by comparing the covariance between item pairs to the amount of overall variance. It reflects the internal consistency between the ASSR1 and ASSR2 thresholds. 0.8 or higher indicates good reliability; 0.9 or higher values are considered excellent [11]. Very high reliability (0.95 or higher) is - in some studies - not necessarily desirable, as this indicates that the items may be redundant [12].
The intraclass correlation coefficient (ICC), that contains both information on the correlation and on a possible systematic difference between the paired values. The ICC actually assesses the reliability of measurement tools by comparing the variability of different measures on the same subject with the total variation across all measures and all subjects [13]. An ICC >0.8 indicates almost perfect agreement [14]. The ICC has advantages over the correlation coefficient, in that it is adjusted for the effects of the scale of measurements.
The standard error of the measurement SEm (which is distinct from the standard error of the mean SE): it is the standard deviation of the sample scores multiplied by the square root of 1 minus the reliability score (Cronbach’s α) [15]. Typically, a range of +/- 1 SEm covers about 68% of the variability, and a range of 1.96 SEm represents a 95% variability range. This is useful to determine the likelihood of a repeated measurement falling within a specific range [6].
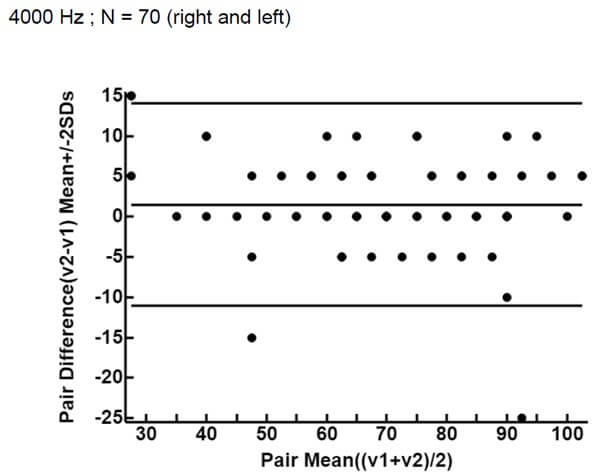
Finally, the Bland Altman plots [16, 17]: in a Bland-Altman ‘difference - plot’ the differences between the two thresholds (ASSR1 and ASSR2) are plotted vs the averages of the two data sets (n = 70). Horizontal lines are drawn at the mean difference, and at the limits of agreement, which are defined as the mean difference ± 1.96 times the SD of the differences. Statistical computations and graphs were made using the Statistica software (Statsoft Inc., Tusla, USA).
All subject data were strictly anonymized, according to the standard rules and procedures applicable for scientific studies within FEDRIS. Our institute has no ethics committee, but a general data protection regulation (GDPR) board who has formally approved the study.
3. Results
Figure 3 shows the histogram of ages (average 60.45 +/- 8.69 years). Both the ages and exposure durations (average 24.94 +/- 11.40 years) are representative of the population of workers introducing a compensation claim for NIHL at FEDRIS.
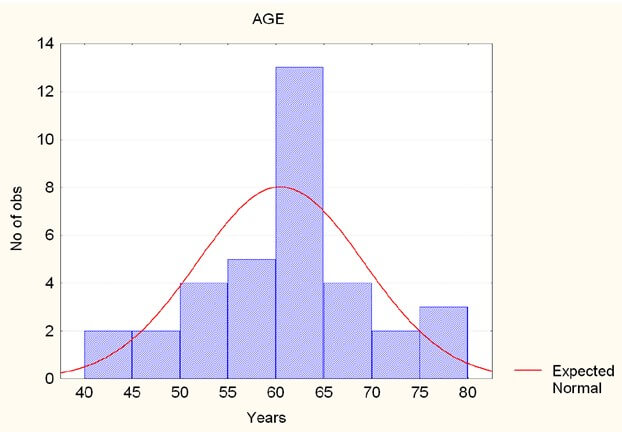
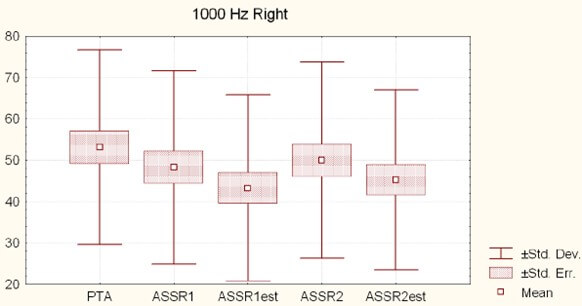
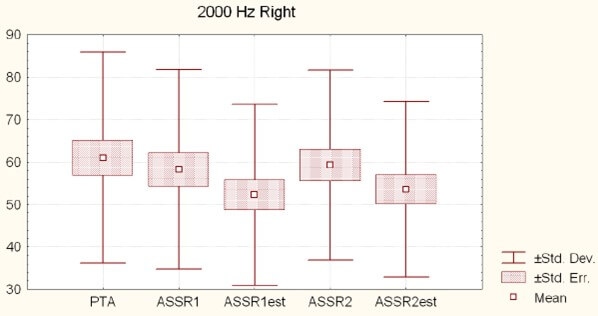
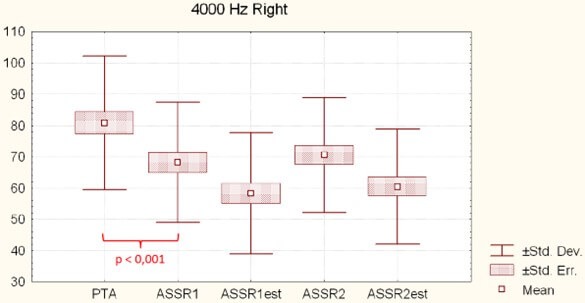
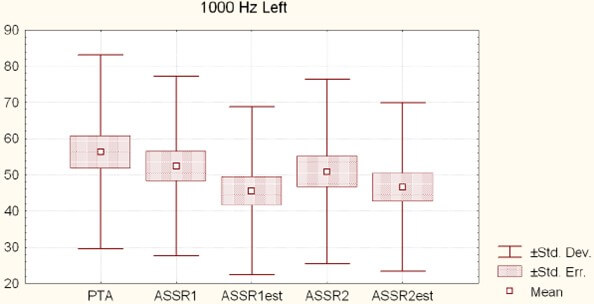
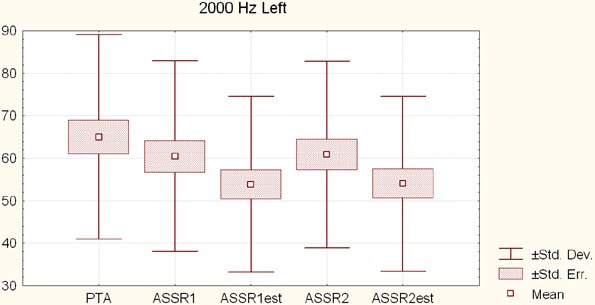
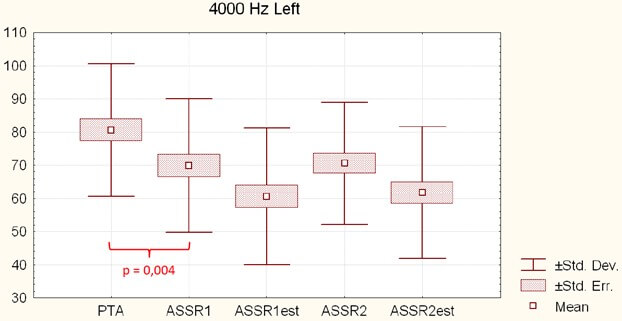
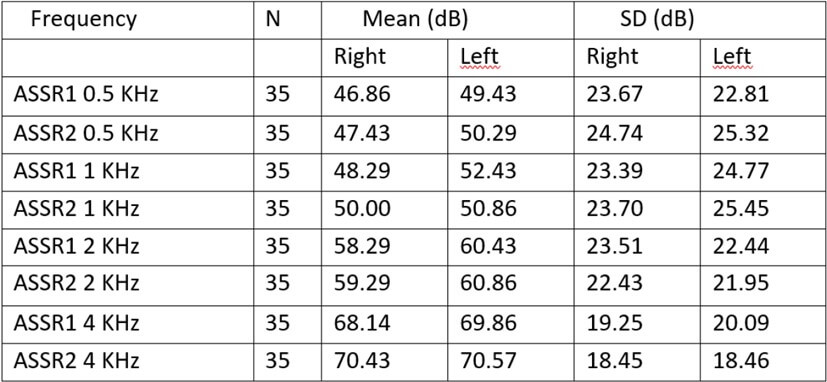
Table 1 gives the mean threshold values (and SD), per ear and per frequency. None of these right / left differences is significant (t-test for paired values). Figures 4-9 show the mean values +/- 1 SE and +/- 1 SD of PTA (pure tone audiometry), ASSR1 (electrophysiological threshold), ASSR1est (estimated psychoacoustic threshold), ASSR2 (electrophysiological threshold) and ASSR2est (estimated psychoacoustic threshold) for respectively 1, 2 and 4 kHz right and left. There is no significant (p <.05) difference between ASSR1 and ASSR2 values, whatever the side and the frequency. Of course, as explained above, the ASSRest values are systematically better (i.e. showing less hearing loss) than the raw ASSR values. In contrary, PTA thresholds are systematically worse (i.e. suggesting more hearing loss) than the raw ASSR thresholds. This confirms the legitimacy of achieving an objective investigation. The differences are clearly significant at 4 kHz (p <.001 right and =.004 left).
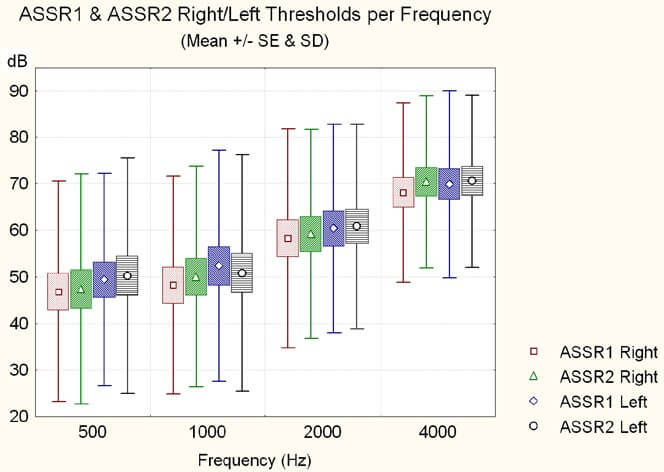
Figure 10 shows the mean ASSR (ASSR1 and ASSR2) thresholds, per frequency (0.5, 1, 2 and 4 kHz) for the right and the left ears (with mean, standard error and standard deviation), indicating the general shape of the audiometric curve: a flat curve for 0.5 kHz and 1 kHz, a rising threshold from 1 kHz on, and a maximal loss on 4000 Hz, as expected in NIHL.
Pearson’s correlation coefficients between ASSR1 and ASSR2 thresholds are:
Right ear: 0.91 (0.5 kHz); 0.90 (1kHz); 0.96 (2 kHz); 0.97 (4 kHz).
Left ear: 0.90 (0.5 kHz); 0.91 (1kHz); 0.95 (2 kHz); 0.93 (4 kHz). All are highly significant (p <.0001).
The correlations are stronger for 2 and 4 kHz than for 0.5 and 1 KHz. For the right ear, the difference between the R value at 4 kHz (0.97) is significantly higher than those at 0.5 (0.91) and 1 KHz (0,90) (p = 0.02 and 0.01 respectively).
The Goodman and Kruskal's gamma values are:
For the right ear: 0.86 (0.5 kHz), 0.81 (1 kHz), 0.92 (2 kHz) and 0.94 (4 kHz).
For the left ear: 0.86 (0.5 kHz), 0.86 (1 kHz), 0.95 (2 kHz) and 0.91 (4 kHz).
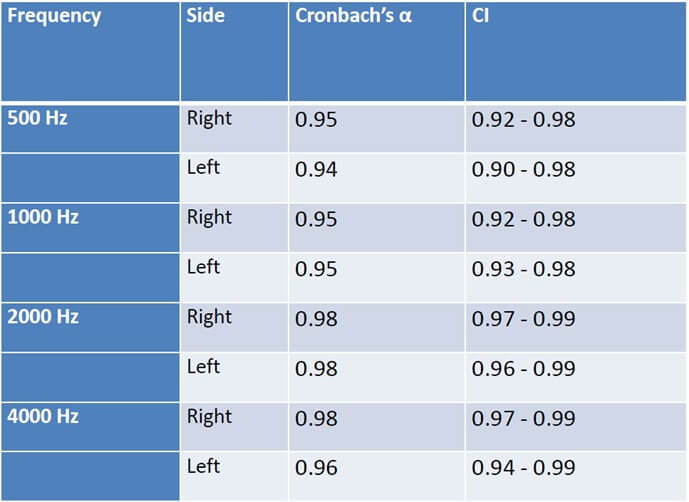
Table 2 displays the Cronbach’s α values (reliability coefficient) per side and frequency: all coefficients are in the range 0.94 - 0.98.
The SEm values are 5.08, 5.28, 3.19 and 3.32 dB for 0.5, 1, 2 and 4 kHz respectively (right and left ears combined.) This means that e.g. for 4 kHz, there is a 95% probability that the threshold would be repeated within +/- 2 SEm, or 6,64 dB.
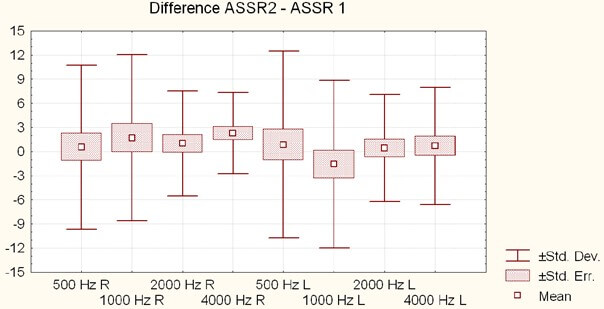
Figure 11 shows the difference plots (ASSR2 - ASSR1) for thresholds at 0.5, 1, 2 and 4 kHz (right and left ears). Average differences for the right ears are: 0.57 (+/- 10.2), 1.71 (+/- 10.35), 1.0 (+/- 6.51) and 2.28 (+/- 5.05) dB for 0.5, 1, 2 and 4 kHz respectively. Average differences for the left ears are: 0.85 (+/- 11.59), 1.57 (+/- 10.41), 0.42 (+/- 6.68) and 0.71 (+/- 7.29) dB for 0.5, 1, 2 and 4 kHz respectively. None of these differences is significant.
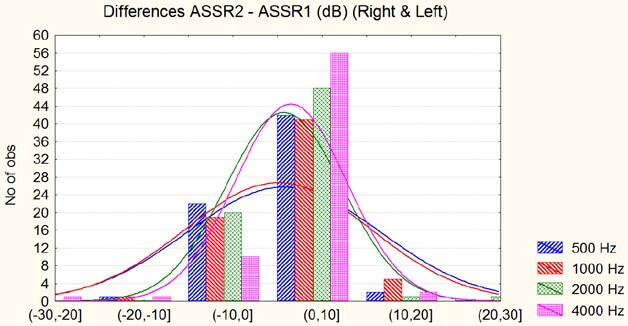
The histogram of the differences between the ASSR1 and ASSR2 thresholds, as displayed in (Figure 12), confirms that the vast majority of differences is less than 10 dB. There is a non-significant tendency in the sense of a slight worsening of the ASSR2 thresholds with respect to ASSR1 .
The ICC, that assesses the reliability of measurement tools by comparing the variability of different measures on the same subject with the total variation across all measures and all subjects [13], is 0.90 (CI: 0.84 - 0.94) for 0.5 kHz, 0.91 (CI: 0.84 - 0.94) for 1 kHz, 0.96 (CI: 0.93 - 0.97) and 0.94 (CI: 0.91 -0.96) for 4 kHz, which means an almost perfect agreement [14].
Figure 13 shows the Bland-Altman plot for 500 Hz: paired comparison of ASSR1 and ASSR2 thresholds (right and left; n = 70). The mean paired difference is + 0,71 dB (CI 95%: - 1,87 to + 3,30). The ICC (Intraclass correlation coefficient) is 0.90 (model 2 Single) 95% CI: 0,84 to 0,94.
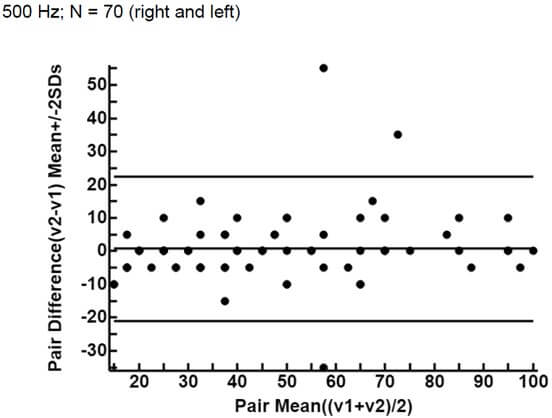
Figure 14 shows the Bland-Altman plot for 1000 Hz: paired comparison of ASSR1 and ASSR2 thresholds (right and left; n = 70). The mean paired difference is + 0,071 dB (CI 95%: - 2,42 to + 2,56). The ICC is 0,91 (model 2 Single) 95% CI: 0,86 to 0,94.
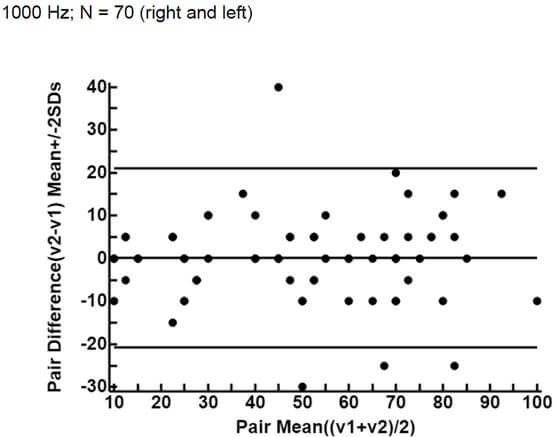
Figure 15 shows the Bland-Altman plot for 2000 Hz: paired comparison of ASSR1 and ASSR2 thresholds (right and left; n = 70). The mean paired difference is + 0,71 dB (CI 95%: - 0,85 to + 2,28). The ICC is 0,96 (model 2 Single) 95% CI: 0,93 to 0,97.
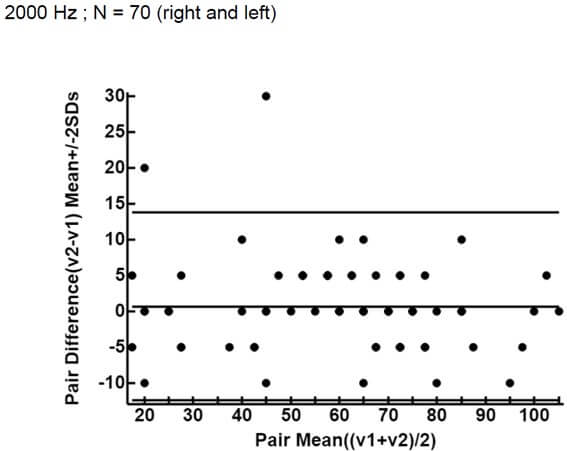
Figure 16 shows the Bland-Altman plot for 4000 Hz: paired comparison of ASSR1 and ASSR2 thresholds (right and left; n = 70) The mean paired difference is + 0,75 dB (CI - 0,0036 to + 2,99). The ICC is 0,94 (model 2 Single) 95% CI: 0,91 to 0,96.
The plots show a good agreement, without either a proportional error (difference increasing with average value) or a variation that strongly depends on the magnitude of the measurements. The validity of estimating the 3 kHz audiometric threshold by averaging the thresholds at 2 and 4 kHz in cases of noise-induced hearing loss is discussed in a previous publication [18].
Interestingly, when threshold values are considered globally (i.e. for all frequencies) a right / left difference appears: the average loss for the right ear is 56.09 dB and for the left ear 58.09 dB. This 2 dB difference just reaches the p 0.05 level. (t-test for matched pairs). This corroborates our previous findings (left ear worse than right ear: 2.23 dB) on a much large sample [19]. The backgrounds have been exhaustively discussed in the other article.
4. Discussion
The ASSR-technique has shown to meet the specific practical requirements of objective electrophysiological hearing assessment in medicolegal context, i.e. delivering frequency specific threshold values for each ear, being noninvasive and well tolerated by the examined subject. Moreover ASSR has also shown to outperform the traditional electrophysiological CERA-technique (cortical evoked response audiometry) and to allow considerable gain of time [1, 2].
However, although it is an essential issue, the test-retest reliability of the ASSR thresholds has so far received limited attention [6]. Hamad et al. [6] investigated this test-retest reliability in 15 normal-hearing adults (mean age 28 years; pure-tone thresholds no worse than 20 dB HL) across two sessions, and found strong test-retest reliability across all carrier frequencies. Their study also compared the reliability of ASSR thresholds with behavioral pure-tone thresholds and found that they exhibited similar mean test-retest reliability. These authors computed the +/- 2SEm values, which represents a 95 % probability of the threshold falling within this range, and find 10 dB for ASSR thresholds. This is in line with our own data in patients with NIHL.
D’haenens et al. 2008 [4] obtained in 29 normal subjects clearly weaker correlation coefficients: 0.34 at 0.5 kHz and 0.55 at 1, 2 and 3 kHz. However their device generated modulation frequencies of 82 - 110 Hz (around 46 Hz in the present work.
Israelsson et al. obtained stronger correlations in 14 slightly hearing-impaired patients: 0.72 - 0.88.
Future work should consider longitudinal studies to track ASSR reliability over time and its sensitivity to minor hearing changes.
5. Conclusion
The ASSR technique fully satisfies the reliability requirements for use in a medicolegal context, when it is necessary to use an objective approach to define, with frequency specificity, the hearing thresholds of subjects who have been occupationally exposed to chronic noise trauma and who are likely to benefit from compensation depending on the degree of hearing impairment. An exhaustive statistical comparison of the results rejects the hypothesis of any significant difference between the results of both exams, whatever severity of hearing loss and frequency. All correlation coefficients (R and ICC) and Cronbach’s α values reach or exceed 0.9. Bland-Altman plots rule out systematic shifts, as well as proportional errors, or variations that depends on the magnitude of the measurements.
REFERENCES
[1] P H DeJonckere, J Lebacq “The
comparison of auditory behavioral and evoked potential responses (steady state
and cortical) in subjects with occupational noise-induced hearing loss.” J
Otol, vol. 16, vol. 16, no. 4, pp. 242-251, 2021. View at: Publisher Site | PubMed
[2] P H
DeJonckere, B Millet, R Van Gool, et al. “Objective frequency-specific hearing thresholds definition
for medicolegal purposes in case of occupational NIHL: ASSR outperforms CERA.” J
Otol, vol. 16, no. 4, pp. 210-219, 2021. View at: Publisher Site | PubMed
[3] Dimitrijevic A., Cone B. Auditory
steady-state responses, in Handbook of Clinical Audiology Katz J, Ed. Wolters
Kluwer Philadelphia 7th Ed. pp. 267-294, 2015.
[4] Wendy D'Haenens, Bart M Vinck, Eddy
De Vel, et al. “Auditory steady-state responses in normal hearing adults: A
test-retest reliability study.” Int J Audiol, vol. 47, no. 8, pp.
489-498, 2008. View at: Publisher
Site | PubMed
[5] Kjell-Erik Israelsson, Renata Bogo,
Erik Berninger “Reliability in Hearing Threshold Prediction in Normal-Hearing
and Hearing-Impaired Participants Using Mixed Multiple ASSR.” J Am Acad
Audiol, vol. 26, no. 3, pp. 299-310, 2015. View at: Publisher Site | PubMed
[6] Hanan Hamad, Nilesh J. Washnik,
Chandan H. Suresh “Next-generation Auditory Steady-State Responses in
Normal-Hearing Adults: A pilot Test-Retest Reliability Study.” J
Otorhinolaryngol Hear Balance Med, vol. 4, no. 2, pp. 6, 2023. View at: Publisher Site
[7] M E Lutman, R R A Coles, J T Buffin “Guidelines for quantification of
noise-induced hearing loss in a medicolegal context.” Clin Otolaryngol, vol.
41, no. 4, pp. 347-357, 2016. View at: Publisher Site | PubMed
[8] King PF, Coles RRA, Lutman ME, et al.
“Assessment of Hearing Disability: Guidelines for Medicolegal Practice.” London
John Wiley and Sons Ltd; 1992. ISBN 13 9781870332040.
[9] Leo A. Goodman, William H. Kruskal
“Measures of association for cross classification.” Journal of the American
Statistical Association, vol. 49, no. 268, pp. 732-764, 1954. View at: Publisher Site
[10] Siegel S., Castellan Jr. N J (1988)
“Nonparametric statistics for the behavioral sciences.” (2nd ed.). New York,
NY: McGraw-Hill Book Company, 1988.
[11]
Richard
A. Zeller “Measurement error, issues and solutions.” Encyclopedia of Social
Measurement, vol. 2, pp. 665-676, 2005. View at: Publisher Site
[12]
Panayiotis Panayides “Coefficient
Alpha: Interpret With Caution.” Europe's Journal of Psychology, vol. 9, no. 4, pp. 687-696,2013. View at: Publisher Site
[13] Portney LG, Watkins MP “Foundations of Clinical Research.
Applications and Practice.” Norwalk: Appleton & Lange, pp. 509-516,
1993.
[14] David Liljequist, Britt Elfving,
Kirsti Skavberg Roaldsen “Intraclass correlation - A discussion and
demonstration of basic features.” Plos One, vol. 14, no. 7, pp.
e0219854, 2019. View at: Publisher
Site | PubMed
[15] James Dean Brown “Shiken: JALT
Testing & Evaluation SIG Newsletter.” vol. 3, no. 1, pp. 20-25, 1999.
[16] J M Bland, D G Altman “Statistical
method for assessing agreement between two methods of clinical measurement.” The
Lancet, vol. 327, pp. 307-310, 1986. View at: Publisher Site
[17] J M Bland, D G Altman “Measuring
agreement in method comparison studies.” Stat Methods Med Res, vol. 8,
no. 2, pp. 135-160, 1999. View at: Publisher Site | PubMed
[18] Philippe Henri DeJonckere, Jean Lebacq “Validity of Estimating the 3 kHz Audiometric Threshold by Averaging the Thresholds at 2 and 4 kHz in Cases of Noise-Induced Hearing Loss.” Archives of Occupational Health, vol. 6, no. 1, pp. 1171-182, 2022. View at: Publisher Site
[19] Philippe Henri DeJonckere, Jean Lebacq “Asymmetry of Occupational Noise Induced Hearing Loss: An Electrophysiological Approach.” Int Arch Otorhinolaryngol, vol. 27, no. 3, pp. e499-e510, 2023. View at: Publisher Site | PubMed