Received: Fri 23, Feb 2024
Accepted: Tue 19, Mar 2024
Abstract
Parkinson's disease (PD) is characterized by divergent clinical symptoms and prognosis, suggesting the presence of distinct subtypes. Identifying these subtypes is crucial for understanding the underlying pathophysiology, predicting disease progression, and developing personalized treatments. In this study, we propose a connectivity-based subtyping approach, which measures each patient's deviation from the reference structural covariance networks established in healthy controls. Using data from the Parkinson's Progression Markers Initiative, we identified two distinct subtypes of de novo PD patients: 248 patients with typical cortical-striato-thalamic dysfunctions and 41 patients showing weakened dorsal raphe nucleus (DRN)-to-cortical/striatal projections. The proposed subtyping approach demonstrated high stability in terms of random sampling of healthy or diseased population and longitudinal prediction at follow-up visits, outperforming the traditional motor phenotypes. Compared to the typical PD, patients with the DRN-predominant subtype were characterized by less server motor symptoms at baseline and distinct imaging biomarkers, including larger striatal volumes, higher concentration of cerebrospinal fluid amyloid-β and amyloid-β/t(p)-tau ratio. Subtype-specific associations and drug effects were identified that the DRN subtype exhibited more pronounced medication effects on motor symptoms, potentially regulated by DRN serotonergic modulation through striatal dopaminergic neurons. The DRN serotonergic inputs also regulated non-motor symptoms, the aggregation of CSF biomarkers and the conversion to more severe disease states. Our findings suggest that the DRN-predominant subtype represents a unique clinical and biological phenotype of PD characterized by an enhanced response to anti-parkinsonian treatment, more favorable prognosis and slower progression of dopamine depletion. This study may contribute to clinical practice of precision medicine, early invention and individualized treatments in PD and other neurodegenerative diseases.
Keywords
Parkinson's disease, neuroimage subtype, structural covariance, motor symptoms, precision medicine, dopaminergic neurons
1. Introduction
Parkinson's disease (PD) is a neurodegenerative disorder that exhibits phenotypic heterogeneity in its clinical characteristics, imaging biomarkers, neuropathology, and disease prognosis. Patients with PD have been subdivided into distinct subtypes based on a variety of criteria. As one of the most commonly used clinical subtyping approach, the motor phenotypes of tremor dominant (TD) and postural instability and gait difficulty (PIGD) have been extensively studied [1]. Distinct motor symptoms and prognoses have been reported for the two subtypes that PIGD was characterized by bradykinesia and rigidity in movements [2], as well as more rapid disease progression and higher risk of dementia [3]. The two subtypes also differed in their responses to treatment that patients with TD respond better to levodopa therapy while patients with PIGD benefit more from physical therapy [4, 5].
Other PD phenotypes have been utilized based on disease onset or prognosis profiles [6] with the early-onset group showing greater nigral cell loss, and the elder-onset patients exhibiting worse prognoses and more rapid cognitive decline. Identifying homogeneous subtypes of de novo PD patients is crucial for understanding their underlying pathophysiology, predicting disease progression, and developing personalized treatments.
Data-driven subtyping approaches represent an important step towards better understanding the heterogeneity of PD pathology [6, 7]. A series of studies have subdivided PD patients into different subgroups according to their clinical characteristics, cognitive profiles, or imaging features [6, 8-10]. For example, Fereshtehnejad and colleagues identified three subtypes of de novo PD patients by applying clustering analysis on a series of clinical characteristics [8]. They reported a distinctive subtype of PD (i.e., diffuse-malignant PD) that was characterized by faster overall disease progression, greater cognitive decline, and brain atrophy in the basal ganglia than other subtypes. Using patterns of dopamine depletion and PET imaging, another study identified four subtypes of PD that were associated with different motor and non-motor symptoms [9]. Using univariate deformation-based morphometry analysis, Wang and colleagues identified two neuroanatomic PD subtypes that were associated with distinct spatial patterns of brain atrophy [10]. These data-driven approaches have demonstrated great potentials in PD subtyping and identifying subgroups with distinct clinical symptoms and disease trajectories. However, their distinctions in the underlying neuropathology and biological mechanisms remain largely unknown, and further research is needed to validate the various clinical outcomes and divergent responses to anti-parkinsonian treatments.
According to the Braak staging theory, Lewy pathology follows a stereotypic pattern, appearing firstly in the lower brainstem, before progressing to the midbrain and basal ganglia, eventually affecting the cerebral cortex [11, 12]. The Braak staging system has provided important insights into the pathogenesis and clinical presentations of PD pathology, and has been supported by a series of studies in post-mortem [12], animal models [13, 14], and in-vivo neuroimaging [15, 16]. An emerging network-based model was proposed that the α-synuclein pathology, the main constituent of the Lewy pathology, propagates along anatomically connected neurons [13] or spatially distributed intrinsic networks [16]. Coinciding with this, our group recently proposed an agent-based spreading model that simulated the propagation of misfolded α-synuclein on structural and functional connectomes and successfully replicated the spatial patterns of empirical atrophy patterns observed in de novo PD [17].
Inspired by the network-based propagation theory, we proposed a connectivity-based subtyping of PD in this study. Using the comprehensive data of the Parkinson's Progression Markers Initiative (PPMI), we aim to identify distinct subtypes of de novo PD patients based on their deviation in structural covariance networks at baseline and systemically investigate their differences in clinical symptoms, brain connectivity and imaging biomarkers, drug effects and disease prognosis. Our findings revealed a unique clinical and biological phenotype, namely the DRN-predominant PD, characterized by reduced serotonergic connections between the dorsal raphe nucleus (DRN) and cortical/striatal regions, better responsive to PD medications and disease prognosis. Compared to the typical PD, patients with the DRN subtype demonstrated less severe baseline motor symptoms, higher concentrations of CSF amyloid-β, larger volumes of striatum and motor cortex, as well as higher dopamine release at longitudinal scans.
2. Materials and Methods
2.1. PPMI Dataset
Data of Parkinson's disease (PD) patients and healthy controls (HC) were downloaded from the Parkinson's Progression Markers Initiative database [18]. All PD patients were diagnosed within 2 years of enrollment, had not received anti-parkinsonian medications at baseline, and underwent comprehensive clinical assessment at baseline and within 5-year follow-up visits. Healthy controls had no neurological illnesses. Only participants with 3T MRI scan at baseline were considered for inclusion in this study. After excluding those with poor image quality, bad segmentation or other processing errors, we included a total of 289 PD patients and 137 HC in the subsequent analyses. Demographic and clinical characteristics can be found at (Table 1). Detailed MRI acquisition protocols of this dataset can be found at (https://www.ppmi-info.org/).
Table
1. Demographic and
clinical characteristics of PD subtypes at baseline.
|
Demography |
Subtype
1 (n=248) |
Subtype
2 (n=41) |
p-value |
|
Age |
61.63 (9.87) |
58.57 (9.43) |
0.0645 |
|
Sex,
male no. (%) |
160 (64.41%) |
27 (65.84%) |
0.8299 |
|
Education,
y |
15.7 (2.9) |
16.17 (2.82) |
0.3351 |
|
Disease
duration, y |
0.60 (0.57) |
0.56 (0.56) |
0.6958 |
|
H&Y
staging |
1.58 (0.51) |
1.41 (0.5) |
0.0593 |
|
Age of
onset |
59.5 (10.17) |
56.73 (9.52) |
0.1027 |
|
UPDRS
total score |
32.72 (13.21) |
26.27 (10.8) |
0.0030
** |
|
Motor symptoms |
|||
|
UPDRS Part II score |
5.94 (4.31) |
5.0 (3.4) |
0.1846 |
|
UPDRS Part III score |
21.14 (8.63) |
15.85 (6.75) |
0.0002
** |
|
Tremor |
4.62 (3.19) |
3.49 (2.62) |
0.0319
* |
|
Rigidity |
3.8 (2.73) |
2.93 (2.11) |
0.0500 * |
|
Tremor/PIGD phenotype (%) |
|
|
|
|
Tremor-dominant |
181 (72.98%) |
29 (70.73%) |
|
|
PIGD-dominant |
39 (15.72%) |
8 (19.51%) |
|
|
Intermediate |
27 (10.88%) |
4 (9.75%) |
|
|
Non-motor symptoms |
|||
|
UPDRS Part I score |
5.66 (4.12) |
5.41 (3.75) |
0.7162 |
|
UPSIT (olfactory) |
22.35 (8.4)
|
22.02 (9.03) |
0.8218 |
|
SCOPA total (autonomic) |
9.79 (6.68) |
7.83 (4.29) |
0.0728 |
|
ESS (sleep) |
5.79 (3.58) |
5.37 (3.24) |
0.4766 |
|
GDS (depression) |
2.38 (2.44)
|
2.02 (2.03) |
0.3790 |
|
STAI (anxiety) |
66.05 (18.59)
|
62.78 (18.45) |
0.2967 |
|
QUIP (impulse control) |
0.29 (0.67) |
0.22 (0.42) |
0.5149 |
|
Cognitive functions |
|||
|
MoCA |
27.23 (2.3) |
27.73 (1.8) |
0.1800 |
|
Benton judgement of line orientation |
12.74 (2.15) |
13.29 (1.85) |
0.1195 |
|
Semantic fluency |
48.95 (11.48) |
49.68 (12.16) |
0.7079 |
|
Symbol digit test |
40.86 (9.49) |
43.58 (7.52) |
0.0821 |
|
CSF biomarkers |
|
|
|
|
amyloid-β |
822.7 (306.4) |
950.0 (375.4) |
0.0190
* |
|
T-tau |
158.6 (44.89) |
170.5 (47.99) |
0.1251 |
|
P-tau |
13.69 (3.84) |
14.46 (4.29) |
0.2524 |
|
α-synuclein |
1343 (465.0) |
1416 (410.4) |
0.3722 |
|
Striatal binding ratio |
|
|
|
|
Caudate
|
1.9883 (0.5602) |
2.1363 (0.6381) |
0.1262 |
|
Putamen |
0.8200 (0.2698) |
0.8803 (0.3596) |
0.2097 |
|
Mean striatum |
1.4042 (0.3914) |
1.5083 (0.4742) |
0.1279 |
All
variables are stated as mean (standard deviation). * indicates p-value<0.05,
** indicates p-value<0.01.
H&Y stage: Hoehn and
Yahr Stage; MDS-UPDRS: Movement Disorder Society-Unified Parkinson’s Disease
Rating Scale; UPSIT: University of Pennsylvania Smell Identification Test;
SCOPA: Scales for Outcomes in Parkinson’s disease-autonomic; ESS: Epworth
Sleepiness Score; GDS: Geriatric Depression Scale; STAI: State-Trait Anxiety
Inventory; MoCA: Montreal Cognitive Assessment; CSF: cerebrospinal fluid.
2.2. Clinical Assessment
The disease severity of PD patients was assessed by the movement disorders society sponsored revision of the unified Parkinson’s disease rating scale (MDS-UPDRS) and the Hoehn and Yahr (H&Y) staging scale. The motor symptoms of PD patients were assessed by MDS-UPDRS Parts II, III, tremor, and rigidity scores. The non-motor symptoms were assessed using MDS-UPDRS Part I, the questionnaire for impulsive-compulsive disorders in Parkinson's disease (QUIP) for impulse control, the University of Pennsylvania smell identification test (UPSIT) for olfactory dysfunction, the scales for outcomes in PD-Autonomic (SCOPA) total score for autonomic dysfunctions, the geriatric depression scale (GDS) score for depression, the state-trait anxiety inventory (STAI) for anxiety, the Epworth Sleepiness Score (ESS) for sleep disturbances, the Montreal cognitive assessment (MoCA) score for global cognition. The motor phenotypes of PD patients were also obtained by classifying them into either tremor-dominant (TD) or postural instability/gait difficulty (PIGD) subgroups.
2.3. Image Preprocessing
T1-weighted MRI image of each patient at each visit was preprocessed with the computational anatomy toolbox (CAT 12) (https://neuro-jena.github.io/cat/). Specifically, the T1-weighted images were first orientated, visually checked for quality, skull-stripped and then segmented into gray matter, white matter, and cerebrospinal fluid (CSF). The segmentation results were visually checked for accuracy and manually edited if necessary. We excluded T1w images with poor image quality (CAT image quality rating <85%) or bad segmentation, remaining 289 patients and 137 healthy controls in the following analysis. Next, the resulting gray matter volume (GMV) images were normalized to the MNI152NLin2009c template, adjusting for individual head size. The normalized GMV images were then spatially smoothed with an 8-mm full-width at half-maximum (FWHM) gaussian kernel. Finally, for region-of-interest (ROI)-level analysis, the mean GMV value of each brain region was extracted using the automated anatomical labeling v3 (AAL3) atlas [19], consisting of 108 cortical and subcortical regions (excluding the cerebellum and brainstem). The GMV values was compared between healthy controls and PD patients, as well as between patients with different subtypes.
2.4. CSF Biomarkers
Cerebrospinal fluid amyloid-β1-42, total tau (t-tau), and phosphorylated tau (p-tau181) were measured by INNO-BIA AlzBio3 immunoassay (Innogenetics Inc.). The concentration of CSF α-synuclein (α-syn) was measured by enzyme-linked immunosorbent assay (Kang et al., 2013). We also calculated the ratios of t(p)-tau with amyloid-β and α-synuclein, as recently recommended by Kang et al., 2016.
2.5. Imaging Biomarkers
A single-photon emission computed tomography (SPECT) scan was performed using the dopaminergic transporter (DAT) tracer I-ioflupane at baseline and follow-up visits. The striatal binding ratio (SBR) was assessed with the occipital lobe serving as the reference region, and separately evaluated for the caudate and putamen as well as the entire striatum. Furthermore, voxel-based morphometry (VBM) analysis was performed on GMV images to measure brain atrophy in PD patients compared to healthy controls. The gray matter volume of seven region-of-interests (ROI) were extracted, including the dorsal raphe nucleus (DRN), substantia nigra (SN), striatal subregions, such as the nucleus accumbens (Nacc), caudate (CAU) and putamen (PUT), and motor cortex including precentral (PreCG) and postcentral gyrus (PoCG).
2.6. Longitudinal Assessments
All clinical measures and neuroimaging data were evaluated annually, at baseline and throughout the 1-to-5-year follow-up periods. Due to the variability of the follow-up time, the most recent recorded data were used for each follow-up visit. In the longitudinal analysis, all available neuroimaging data were included in the subsequent visits, with 289 patients and 137 healthy controls assessed at baseline, 112 patients at 1-year follow-up, 120 patients at 2-year follow-up, and 150 patients at 4-year follow-up. We did not include the 3rd and 5th-year follow-ups due to small sample sizes in these visits (only 6 and 8 patients with imaging data, respectively).
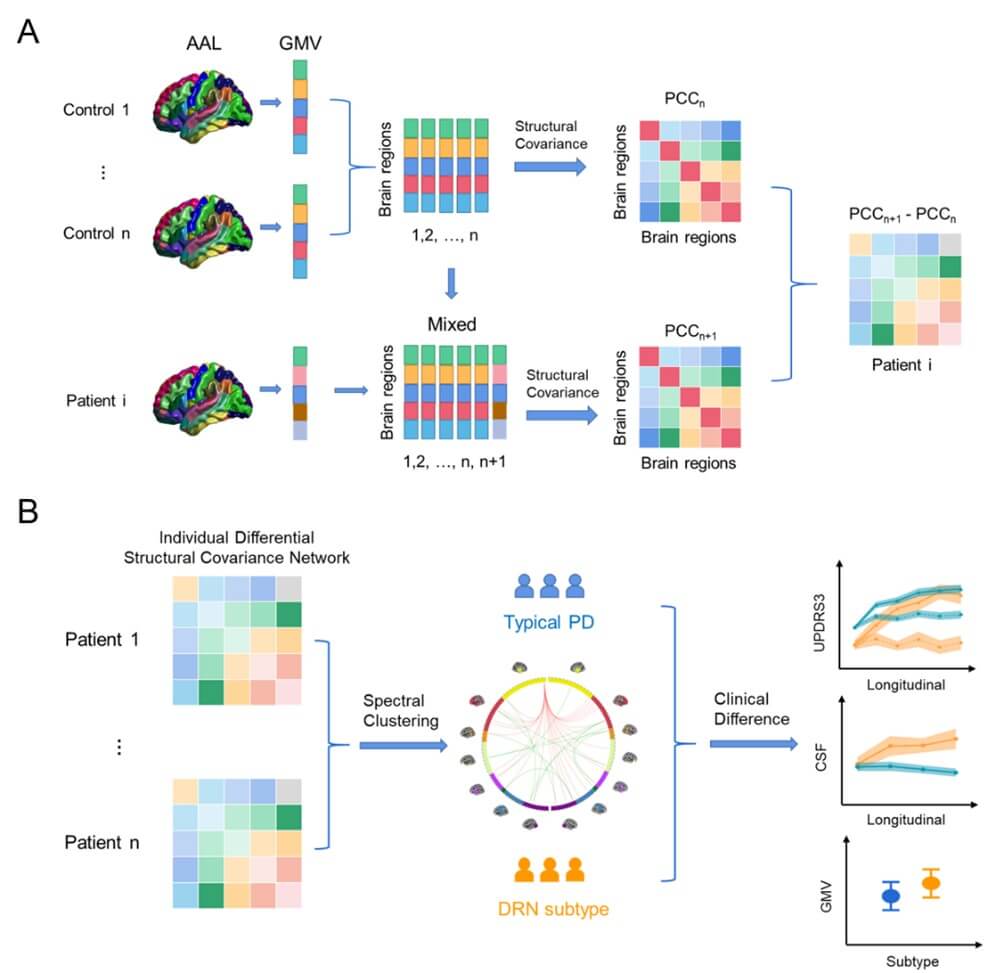
2.7. Structural Covariance Network-Based PD Subtyping
We applied the individual differential structural covariance network (IDSCN) approach to assess individual differences in the structural covariance patterns. This approach has identified individual-specific structural covariance network (SCN) that associated with variabilities in cognitive and behavioral traits [20]. In this study, we employed the IDSCN method to evaluate patient-specific alterations in the structural covariance patterns and categorize them into distinct subtypes accordingly. The key concept is to establish a reference SCN based on normative structural covariance patterns in healthy controls and compare each patient's structural covariance to this reference SCN in order to quantify their deviations in the connectivity patterns. Specifically, we first generated 108 ROIs from the AAL3 atlas (excluding the cerebellum and brainstem) and extracted the mean GMV of each ROI for each participant. A reference SCN was then constructed by calculating Pearson correlation coefficients between the mean gray-matter volumes (GMV) of brain regions among all participants in the healthy control group, adjusting for age, gender, education level, and total intracranial volume. Subsequently, a perturbed SCN was created by adding a single patient’s GMV data to the sample of healthy controls and reconstructing a new SCN. The difference between the perturbed and reference SCN was computed using the equation:
\[z-score=(N-1)*\frac{SCN_{paitent}-SCN_{normal}}{1-SCN_{normal}^2}\]
where N is the number of healthy controls (N = 137 in our case). The z-score quantifies the disturbance of the patient's SCN relative to the normative SCN.
For the subtyping analysis, we selected a total of 38 SCN edges that were significantly altered in more than 5% of patients and passed the multiple comparison correction using the Bonferroni correction (P<0.05). We used the z-scores of these SCN edges as features in the clustering analysis to group all PD patients into different subtypes. To assess the stability of the subtyping results, we applied the approach by using various clustering methods (such as spectral clustering or hierarchical clustering), distance metrics (euclidean distance or cosine distance) and different numbers of clusters (ranging from 2 to 10). We used the silhouette score (SI) to evaluate the performance of the clustering results, which estimates the compactness within each cluster and the separation among different clusters. The clustering solution with the largest silhouette score was chosen as the final subtyping result. A flowchart of the analysis is shown in (Figure 1).
2.8. Stability Analysis of Subtyping
We evaluated the stability of the proposed connectivity-based subtyping model in three folds. Firstly, we assessed the impact of the reference SCN on the subtyping results by randomly sampling the healthy controls with replacement using a bootstrapping technique. To achieve this, we generated 100 bootstrap samples of the healthy control group, recalculated the reference SCNs based on the generated samples, assessed the derivation of SCN for each patient, and performed the clustering analysis on the z-scores of selected SCN edges. To measure the consistency of the subtyping, we compared the clustering outcomes of bootstrap samples with the original subtyping results of PD patients. The average accuracy among 100 samples was reported, indicating the proportion of PD patients assigned to the same subtype as compared to the original subtyping.
Secondly, at baseline, we assessed the stability of PD subtyping by randomly sampling PD patients. Specifically, we generated 1000 bootstrap samples of PD patients using their neuroimaging data at baseline. For each bootstrap sample, we re-generated the subtyping result of selected PD patients and then trained a support vector machine (SVM) classifier with the RBF kernel, i.e., using the z-scores of the SCN edges as input features and the subtyping result as the output label. The remaining (unselected) PD patients were used as the test set to evaluate the performance of the subtyping model. Due to the imbalance in sample sizes between the two subtypes, we used a weighted_f1score, which accounts for the number of cases in each subtype, to measure the stability of the subtyping results on sampled PD patients as compared to the original subtyping result. The averaged f1-score among 1000 bootstrap samples was reported as the stability of the subtyping model at baseline.
Thirdly, we also investigated the longitudinal stability of PD subtyping during disease progression. To do this, we trained an SVM classifier based on the neuroimaging data of PD patients at baseline and used it to predict their subtyping results using the longitudinal scans collected throughout the 1-to-5-year follow-up visits. At each follow-up visit, we evaluated the longitudinal stability of the PD subtyping by comparing the subtyping result with the subtyping results at baseline using the weighted_f1score.
However, due to a limited amount of imaging data at the 3- and 5-year follow-ups (only 6 and 8 patients had T1w-imaging data, respectively), we excluded the 3- and 5-year follow-ups from the annual evaluation of the longitudinal stability. Besides, we grouped the follow-up visits into the short visits (1-, 2-, and 3-year follow-ups) and long-term visits (4- and 5-year follow-ups), and evaluated the longitudinal stability separately. Furthermore, we compared the longitudinal stability of PD subtyping to the motor phenotypes of PD patients, based on specific motor symptoms and clinical features, such as tremor-dominant (TD) or postural instability/gait difficulty (PIGD).
2.9. Statistical Analysis
We evaluated the group differences between the two subtypes at baseline using two-samples T-tests, including differences in imaging data (structural covariance, grey-matter volume, dopaminergic transporter imaging), clinical measures (motor and non-motor symptoms measured by Parkinson’s disease rating scale (UPDRS) items, tremor and rigidity scores, and other non-motor questionnaires) and CSF biomarkers (amyloid-β-42 [Aβ42], total tau [T-tau], phosphorylated tau 181 [P-tau], and α-synuclein [α-syn] levels). All results were corrected for multiple comparisons using false discovery rate (FDR). The association between GMV of subcortical regions, DAT and clinical symptoms were evaluated by using Pearson’s correlation coefficient.
2.10. Mediation Analysis and Neural Pathways
We hypothesized that the motor symptoms of the typical PD subtype would be impacted by striatal dopaminergic neurons and nigrostriatal dopaminergic pathways, while the motor symptoms of the atypical PD subtype would be influenced by 5-HT neurons in DRN and their serotonergic inputs to the striatum. In order to test our hypotheses, we utilized mediation analysis, which aims to investigate the causal chain in which one variable (X) affects a second variable (Y) through a mediator variable (M). The indirect effect, or mediational effect, represents the portion of the relationship between X and Y that is mediated by M. We utilized the Mediation Toolbox [21] for the mediation analysis on the two subtypes, and included the drug efficacy on clinical symptoms (i.e., changes in UPDRS, ∆UPDRS) as the dependent variable (Y), dopamine levels in the striatum (i.e., striatal binding ration, SBR) as the mediator variable (M), and GMV of the striatum or DRN as the independent variable (X) respectively for the two subtypes.
2.11. Gene Enrichment Analysis
We further explored the potential biological mechanism that underlie the differentiation of the two PD subtypes, as measured by the T statistic map of regional GMV differences. We utilized the allen human brain atlas (AHBA, https://human.brain-map.org/) transcriptomes dataset [22] to extract the gene expression data. Specifically, we preprocessed the gene expression data using the abagen toolbox (https://github.com/rmarkello/abagen) and mapped it to the AAL3 atlas, which consists of 108 brain regions. The gene expression values of brain samples collected from 6 donors were gathered and assigned to the corresponding region. This aggregation resulted in a regional gene expression matrix consist of 108 brain regions (at least 1 probe located within each region) and 15,633 genes. Additionally, we collected the group differences of regional GMV as the regional neuroimaging feature matrix. Next, we employed a partial least squares (PLS) regression model to perform the neuroimaging–transcription association analysis. Unlike traditional regression methods, PLS uses the gene expression (the predictor variables) to predict regional differences in brain atrophy between the two subtypes (the response variables). The first PLS component is the linear combination of the weighted gene expression scores that are most strongly correlated with the brain atrophy difference map.
The statistical significance of the variance explained was assessed by permuting the response variables 1,000 times and estimating the error of each gene’s weight by bootstrapping. The contribution of each PLS component was assessed by the z-score, i.e., the ratio of each gene’s weight to its bootstrap SE. To perform pathway enrichment analysis, we retained only genes exhibiting | z | > 3 for the chosen PLS component and used the Kyoto Encyclopedia of Genes and Genomes (KEGG) database in combination with the efficient tool, Metascape (https://metascape.org/) [23].
3. Results
3.1. Subtyping of De Novo Parkinson Disease
We utilized the individual differential structural covariance network approach to assess each patient’s abnormality in structural covariance networks compared to healthy controls. We uncovered two distinct subtypes of de novo PD by applying the spectral clustering on the z-scores of altered SCN edges. Specifically, subtype 1 (n=248) represents the typical PD subtype, exhibiting reduced basal-ganglia-to-cortical connections compared to healthy controls. Subtype 2 (n=41), namely the DRN-predominant subtype, is characterized by weakened DRN-to-cortical/striatal projections and elevated cortical-to-cortical connections. Similar 2-subtype classification result was revealed by performing hierarchical clustering analysis with ward linkage (Figure S1).
The proposed subtyping method showed a high degree of stability. Firstly, the perturbation of the reference SCN induced by random sampling of healthy controls had minimal impact on the subtyping results (mean accuracy: 0.88, std: 0.03 over 100 trials). Secondly, bootstrap sampling of PD patients at baseline also demonstrated near-perfect consistency in the PD subtyping results (mean: 0.94, std: 0.02 over 1000 samples). Lastly, and most importantly, the longitudinal prediction of PD subtyping was remarkably stable at both short-term visits (within 3-year follow-ups, weighted_f1score=0.94) and long-term visits (after 3-year follow-ups, weighted_f1score=0.88). The longitudinal prediction for each follow-up visit was shown in (Table 2), which demonstrates high consistency at annual visits, outperforming conventional motor phenotypes of TD/PIGD (averaged weighted_f1score=0.91 vs 0.73).
Table
2. Stability
analysis of connectivity-based subtyping of Parkinson’s disease.
|
Baseline and Follow-up visits |
TD/PIGD phenotypes |
Our subtyping |
|
|
baseline |
N/A |
0.94 |
|
|
1-year |
0.77 |
0.92 |
|
|
2-year |
0.76 |
0.95 |
|
|
3-year |
0.74 |
N/A |
|
|
4-year |
0.69 |
0.87 |
|
|
5-year |
0.68 |
N/A |
|
|
Average of follow-up visits |
0.73 |
0.91 |
|
TD: Tremor Dominant; PIGD:
Postural Instability and Gait Difficulty.
3.2. Brain Connectivity and Clinical Measures
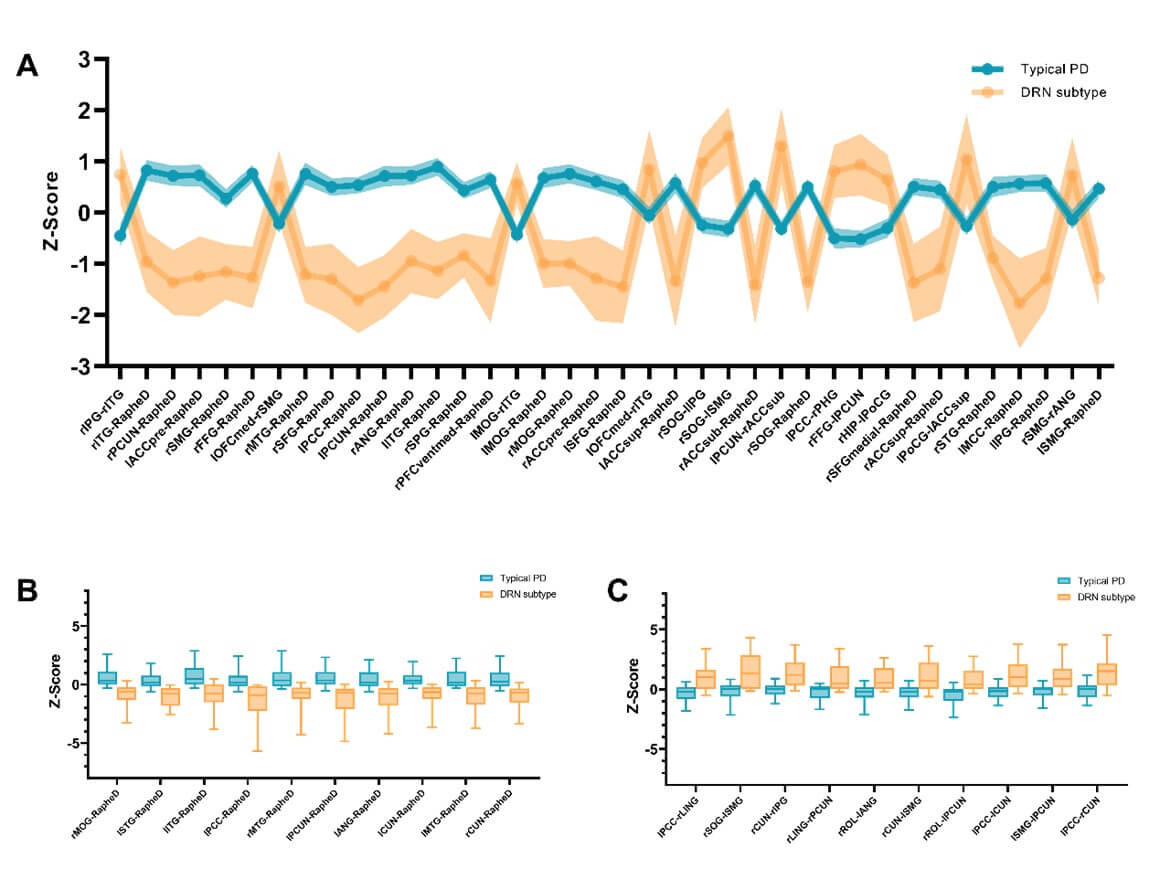
We uncovered subtype-specific alterations of the structural covariance networks (SCN) in the two PD subtypes. We identified the top 38 SCN edges that altered in more than 5% of PD patients (with Bonferroni correction p<0.05). These SCN edges mainly involved the DRN-to-cortical/striatal connections (Table S1) and showed differential patterns in the two PD subtypes ((Figure 2A & Table S2), FDR corrected p-value<0.001). Specifically, the DRN-to-cortical connectivity was significantly weakened in patients with the DRN subtype, but showed an increasing trend in the typical PD (Figure 2C). For striatal regions, both PD subtypes demonstrated significant alterations in the DRN-to-striatal connectivity compared to healthy controls, but weakened in patients with the DRN subtype (T-score=-4.220, p=0.0001 for putamen), while strengthened in the typical PD subtype (T-score=3.748/5.974, p=0.0002/8.0e-9, respectively for caudate and nuclear accumbens). Among cortical regions, we observed elevated cortico-cortical connectivity in patients with the DRN subtype, particularly in the default mode regions (DMN) and visual areas (Figure 2C and Table S2). In contrast, only mild reductions of these SCN edges were detected in the typical PD subtype.
The alterations of DRN connectivity may contribute to the development of clinical symptoms and cognitive deficits in PD. For instance, as shown in (Figure 3), the DRN-to-DMN connectivity was negatively associated with MoCA (r=-0.355, p=0.026), ESS (r=-0.361, p=0.022) and SBR (r=-0.487, p=0.001) in patients with the DRN subtype. In contrast, the DRN-to-striatal connectivity was positively associated with rigidity (r=0.173, p= 0.011), SCOPA (r=0.202, p=0.003), and STAI (r=0.139, p=0.045) in patients with the typical PD subtype. Our results suggest that serotonergic projections from DRN neurons may be involved in the modulation of motor and non-motor symptoms in PD.
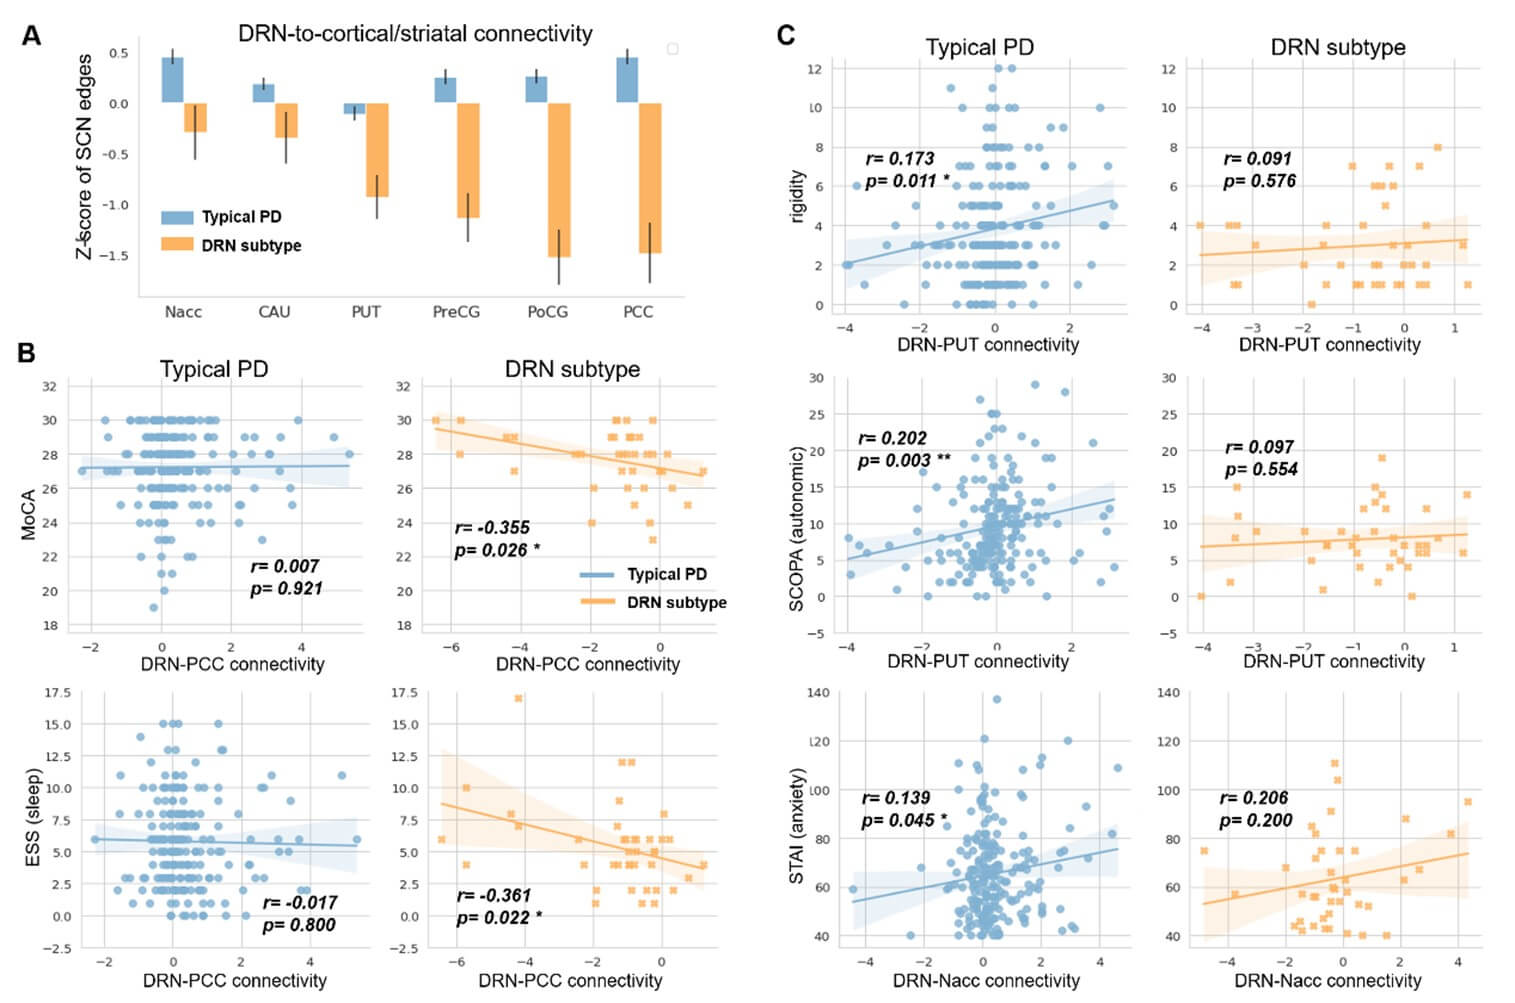
DRN: Dorsal Raphe Nucleus; CAU: Caudate; PUT: Putamen; Nacc: Nuclear Accumbens; PreCG: Precentral Gyrus; PoCG: Postcentral Gyrus; PCC: Posterior Cingulate Cortex.
Regarding behavioral assessment, we found no significant differences between the two subtypes in terms of baseline non-motor symptoms (Table 1), including UPDRS PART I, UPSIT (olfactory), SCOPA (autonomic), GDS (depression) and STAI (anxiety) scores, or cognitive functions, such as MoCA and the semantic fluency. Furthermore, there were no differences between the two subtypes in disease duration, staging, or age of onset. However, patients with the DRN subtype demonstrated less severe motor symptoms compared to the typical PD (p<0.05, Table 1), as evidenced by significantly lower UPDRS3, tremor, and rigidity scores.
3.3. Imaging Features and Biomarker Profiles
In addition to SCN edges, other subtype-specific neuroimaging makers have also been revealed (Figure 4). Firstly, compared to both healthy controls and the typical PD subtype, patients with the DRN subtype exhibited significantly larger cortical and subcortical brain volumes (Table 3, FDR corrected p-values<0.05), particularly in the precentral and postcentral gyrus, as well as striatal subregions including putamen and nucleus accumbens. We also found a trend towards larger volumes of DRN (p-value=0.1278) and substantia nigra (p-value=0.016) for the DRN subtype. In patients with the typical PD subtype, we did not observe significant alterations in the GMV of these cortical and subcortical regions, except for a trend towards larger volume of nucleus accumbens compared to healthy controls (p-value=0.072).
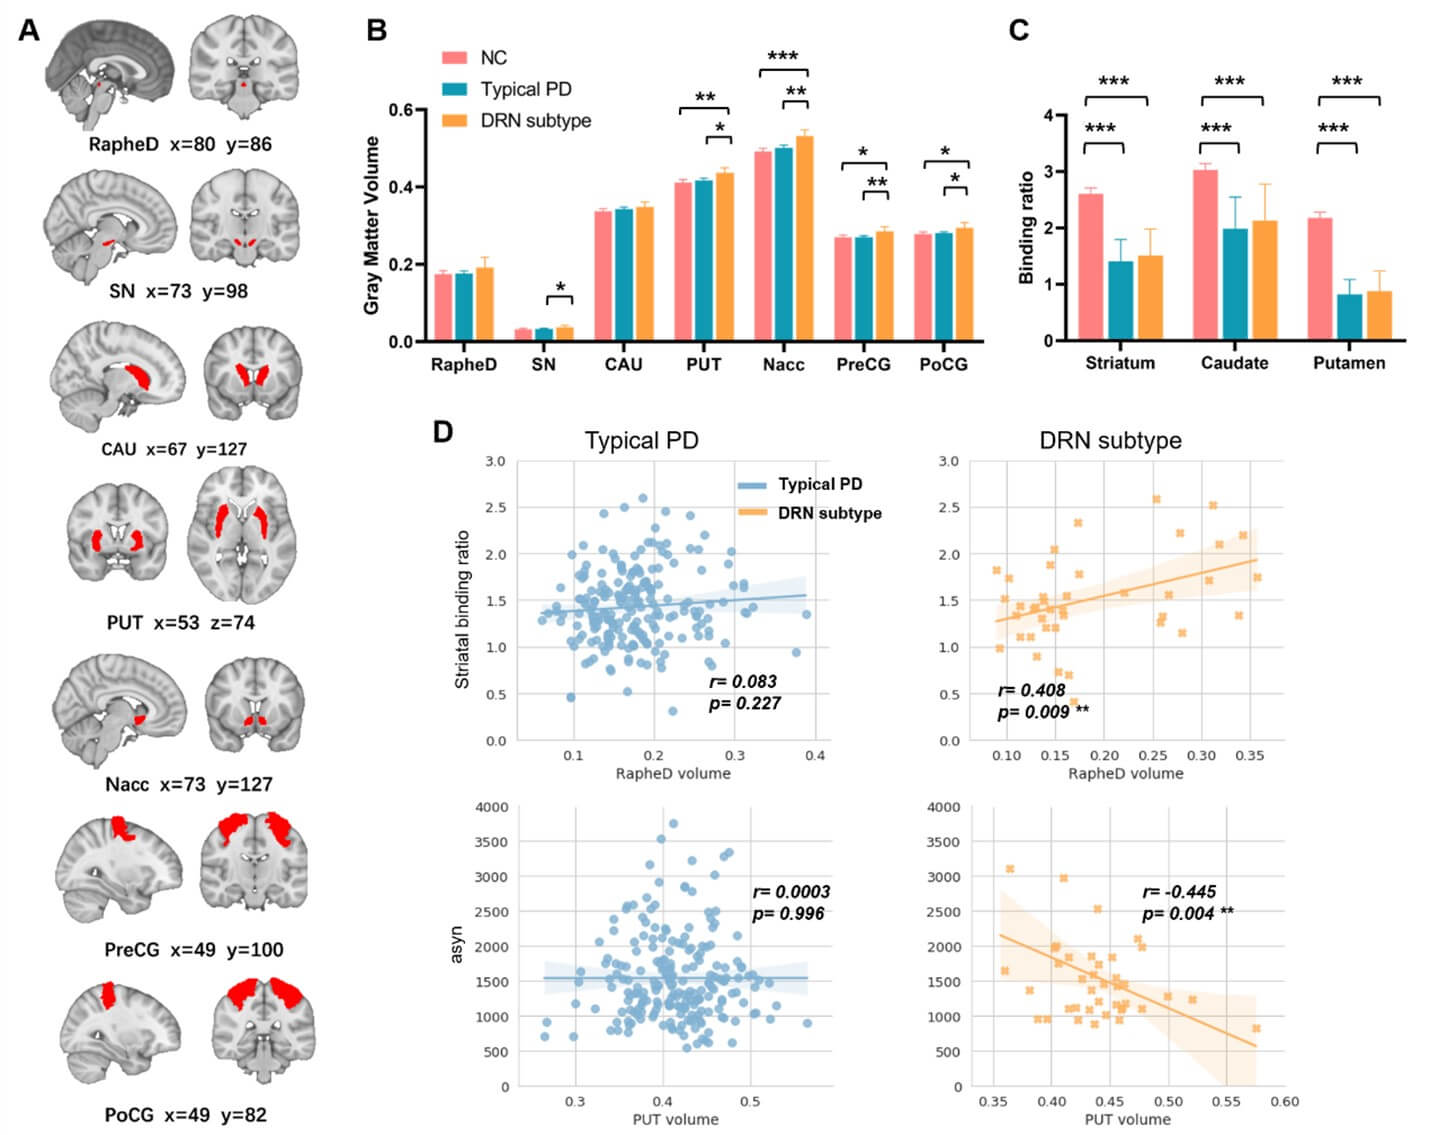
RapheD: Dorsal Raphe Nucleus; SN: Substantia Nigra; CAU: Caudate; PUT: Putamen; Nacc: Nuclear Accumbens; PD: Parkinson’s Disease.
* indicates p-value<0.05, ** indicates p-value<0.01, *** indicates p-value<0.001.
Table
3. Differences in
grey matter volumes between the two PD subtypes.
We
detected subtype-specific atrophy in cortical and subcortical regions in PD
patients. Among which, the orbital frontal gyrus and ventral striatum showed
significantly larger grey matter volumes in patients with the DRN subtype (FDR
corrected p-value<0.05), as well as larger volumes in putamen and substantia
nigra. * indicates p-value<0.05, ** indicates
p-value<0.01.
|
Abbrev. |
Region names |
Typical PD vs. DRN subtype |
||
|
T-score |
P-value |
FDR corrected p-value |
||
|
OLF |
Olfactory
cortex |
-4.2039 |
0.0000035 |
0.0019
** |
|
Nacc |
Nucleus
accumbens |
-3.4480 |
0.0006492 |
0.0144
* |
|
OFCmed |
Medial
orbital gyrus |
-3.3929 |
0.0007887 |
0.0144
* |
|
REC |
Rectus
gyrus |
-3.1406 |
0.0018616 |
0.0224 |
|
ITG |
Inferior
temporal gyrus |
-3.1125 |
0.0020421 |
0.0224 |
|
CAL |
Calcarine
fissure |
-3.0186 |
0.0027671 |
0.0253 |
|
HES |
Heschls
gyrus |
-2.9636 |
0.0032945 |
0.0258 |
|
MOG |
Middle
occipital gyrus |
-2.8998 |
0.0040220 |
0.0276 |
|
IOG |
Inferior
occipital gyrus |
-2.8516 |
0.0046648 |
0.0276 |
|
SOG |
Superior
occipital gyrus |
-2.8043 |
0.0053865 |
0.0276 |
|
CUN |
Cuneus |
-2.7953 |
0.0055343 |
0.0276 |
|
LING |
Lingual
gyrus |
-2.7441 |
0.0064491 |
0.0281 |
|
STG |
Superior
temporal gyrus |
-2.6886 |
0.0075928 |
0.0281 |
|
OFCpost |
Posterior
orbital gyrus |
-2.6878 |
0.0076120 |
0.0281 |
|
AMYG |
Amygdala |
-2.6852 |
0.0076701 |
0.0281 |
|
ROL |
Rolandic
operculum |
-2.6262 |
0.0090972 |
0.0299 |
|
PreCG |
Precentral
gyrus |
-2.6199 |
0.0092632 |
0.0299 |
|
PoCG |
Postcentral
gyrus |
-2.5438 |
0.0114901 |
0.0351 |
|
INS |
Insula |
-2.5105 |
0.0126056 |
0.0364 |
|
OFCant |
Anterior
orbital gyrus |
-2.4492 |
0.0149135 |
0.0384 |
|
SN |
Substantia
nigra |
-2.4119 |
0.0164955 |
0.0384 |
|
TPO |
Temporal
pole |
-2.4007 |
0.0170000 |
0.0384 |
|
MTG |
Middle
temporal gyrus |
-2.3948 |
0.0172699 |
0.0384 |
|
ANG |
Angular
gyrus |
-2.3944 |
0.0172897 |
0.0384 |
|
PUT |
Putamen |
-2.3904 |
0.0174746 |
0.0384 |
|
SPG |
Superior
parietal gyrus |
-2.3670 |
0.0185980 |
0.0393 |
Secondly, both PD subtypes showed significantly lower striatal binding ratios (SBR) than healthy controls (FDR corrected p-values<0.0001), as measured by the dopamine transporter (DAT) imaging. We did not observe significant difference in baseline SBR between the two PD subtypes, either in the whole striatum or its subregions (Figure 4C & Table 1). However, patients with the DRN subtype showed higher striatal dopamine levels at follow-up visits (T=2.1335, p=0.0332). Moreover, we found that larger DRN volume was associated with higher baseline SBR in patients with the DRN subtype (r=0.408, p=0.009) but not in the typical PD subtype (r=0.083, p=0.227).
Thirdly, at baseline, patients with the DRN subtype exhibited higher concentration of cerebrospinal fluid (CSF) amyloid-β than the typical PD (T-score=2.359, p=0.019). No significant differences in either tau phosphorylation (including levels of t-tau and p-tau) or Lewy body pathology (i.e., concentration of α-synuclein) were found between the two PD subtypes (Table 1). Moreover, we found that in patients with the DRN subtype, larger volume of the putamen was associated with lower concentration of α-synuclein (r=-0.445, p=0.004, Figure 4D), and the reduction of DRN-to-striatal connectivity was associated with higher aggregation of CSF amyloid-β (r=-0.350, p=0.029, Figure S3).
To summarize, compared to the typical PD subtype, patients with the DRN subtype exhibited less severe motor symptoms and distinctive imaging biomarkers at baseline, including weakened serotonergic projections to cortical and striatal regions, larger brain volumes of the striatum and motor cortex, and higher aggregation of CSF amyloid-β. Subtype-specific regulations on striatal dopamine levels and CSF biomarkers were also revealed in patients with the DRN subtype. Our findings suggest that the DRN subtype may represent a distinct clinical and biological phenotype of de novo PD.
3.4. Disease Progression
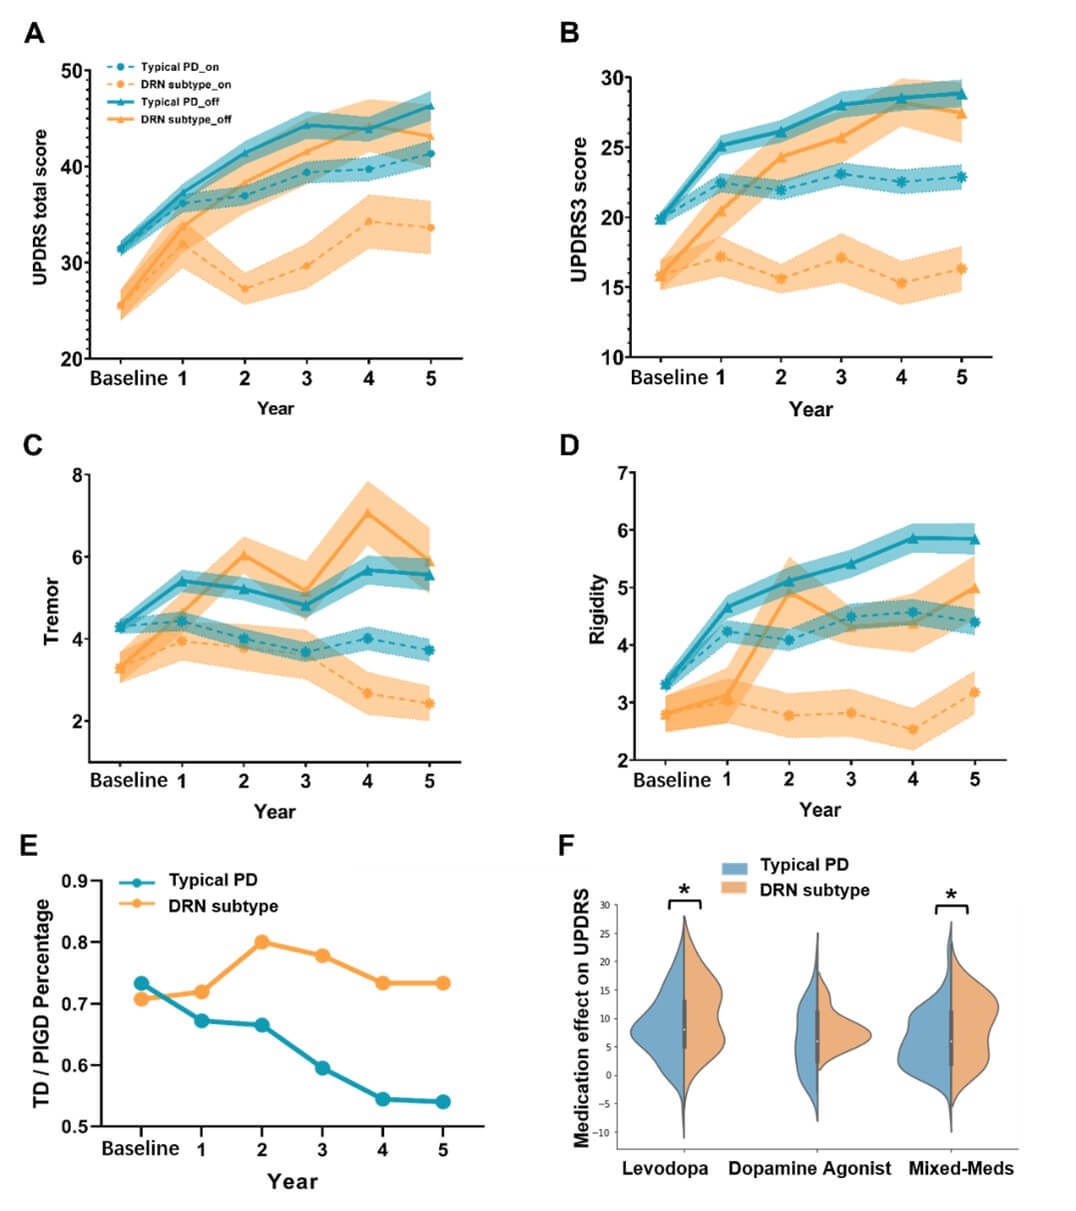
We investigated the longitudinal trajectories of PD patients with the two subtypes in terms of clinical characteristics (Figure 5) and CSF biomarkers (Figure 6). At baseline, patients with the DRN subtype displayed less severe clinical symptoms than the typical PD, as measured by UPDRS (T-score=3.000, p=0.0030). At the follow-up visits, both PD subtypes exhibited progressive worsening of motor symptoms when off medication. Intriguingly, after receiving anti-parkinsonian medications, patients with the DRN subtype did not experience progressive degeneration of motor symptoms (follow-ups vs. baseline, on medication, T-score=0.338, p=0.735, for UPDRS3). In contrast, motor symptoms in the typical PD subtype continued to worsen as the disease progressed (follow-ups vs. baseline, on medication, T-score=3.617, p=0.0003). Furthermore, both PD subtypes showed continued cognitive decline during disease progression (p<0.05), with no significant differences between the two subtypes in terms of MoCA or its annual change rate.
The severity of tremor and rigidity symptoms was effectively controlled by PD medications as the disease progressed (Figure 5). Specifically, when off medication, both subtypes showed progressive worsening of tremor symptoms at follow-up visits (T-score=4.012/3.768, p-values<0.001, respectively for the DRN and typical PD). Moreover, patients with the typical PD demonstrated more severe symptoms of rigidity as the disease progressed when on- and off-medication (follow-ups vs. baseline, T-score=5.072/9.216, p-values<0.001, respectively). In contrast, patients with the DRN subtype exhibited no progressive changes of motor symptoms after taking PD medications (follow-ups vs. baseline, T-score=0.015/0.192, p=0.987/0.847, respectively for tremor and rigidity).
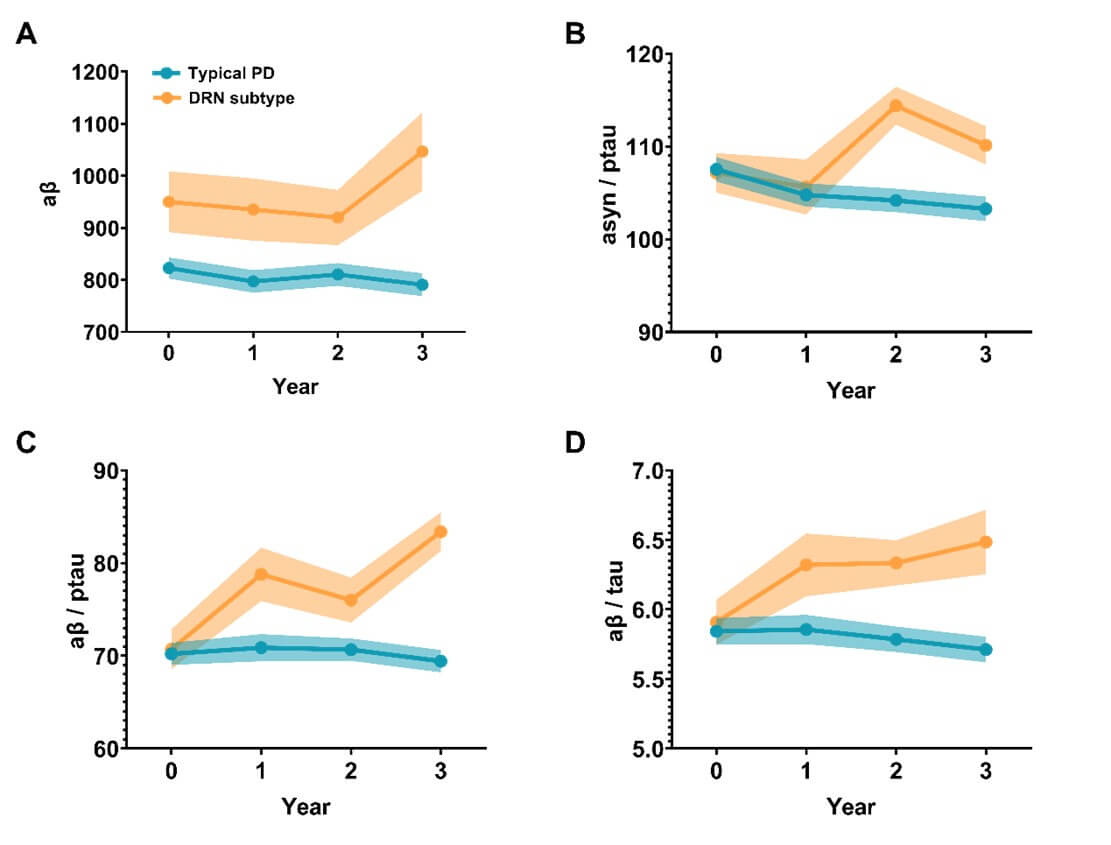
Compared to the typical PD subtype, patients with the DRN subtype demonstrated higher concentration of CSF amyloid-β at baseline (T-score=-2.3592, p=0.0190) and higher values of amyloid-β/t(p)-tau ratios at all follow-up visits (T-score=4.4083 and 4.0381 respectively, p-values<0.001). Over the course of disease progression, the concentrations of CSF biomarkers remained relatively stable in the typical PD subtype (Figure 6). In contrast, patients with the DRN subtype displayed an increasing trend for the ratios of amyloid-β/t-tau (follow-ups vs. baseline, T-score = 2.2345, p = 0.0274) and amyloid-β/p-tau (follow-ups vs. baseline, T-score = 3.146, p = 0.0021). Moreover, patients with the DRN subtype also showed higher ratios of α-syn/p-tau (T-score = 3.8775, p < 0.001) after the 2-year follow-ups.
* indicates p-value<0.05.
We also explored the composition of motor phenotypes, i.e., tremor-dominant (TD) or postural instability/gait difficulty (PIGD), in the two identified subtypes. Specifically, the ratio of TD/PIGD phenotypes was relatively stable in patients with the DRN subtype at all follow-up visits over the 5-year period (around 3:1). In contrast, the TD/PIGD ratio of the phenotypes in patients with the typical PD subtype sustainably decreased from around 3:1 at baseline to 1:1 at the 5-year follow-up, with an increasing number of patients transitioning from TD to PIGD phenotypes over the course of disease progression.
3.5. Anti-Parkinsonian Treatment Effect
The drug effects of PD patients were evaluated by the reduction of UPDRS scores (∆UPDRS) comparing on and off medication states at each follow-up visit. The unmedicated patients (i.e., patients with ‘PD_MED_USE’=0) were excluded for this analysis (including all patients at baseline and nearly half of patients at the 1-year follow-up). At all follow-up visits, there was no significant difference between the two subtypes in terms of medication use strategies (Levodopa or Dopamine Agonist or mixing with other medications, Figure S8).
The motor symptoms were partially relieved after administering anti-parkinsonian medications for both typical PD (T-score=7.573, p=6.4e-14 for ∆UPDRS3) and DRN subtypes (T-score=4.016, p=7.7e-5 for ∆UPDRS3). Yet, patients with the DRN subtype showed more pronounced drug effects compared to the typical PD (T=3.159, p=0.0016 for ∆UPDRS3), as demonstrated in (Figures 5F & S9). This effect remained significant when only taking Levodopa or combining Levodopa with other medications (T-score=1.97, p-values<0.05). Similarly, patients with the DRN subtype showed greater medication effects on tremor and rigidity symptoms after taking PD medications (T-score=2.561 and 2.363, p=0.0106 and 0.0183, respectively for ∆tremor and ∆rigidity).
3.6. Atypical Pathological Pathways
We uncovered several subtype-specific effects regarding the relationships among DRN volumes/projections, striatal dopamine levels and treatment effects in patients with de novo PD. Firstly, subtype-specific associations were detected between the gray matter volume of the DRN and striatal binding ratio, which was only present in patients with the DRN subtype (r=0.408, p=0.009) but not for the typical PD subtype (r=0.083, p=0.227). In addition, DRN regulated striatal dopamine levels through different neural pathways such that SBR was associated with DRN-to-putamen/postcentral gyrus connectivity in patients with the DRN subtype (r= -0.314/-0.396, p= 0.048/0.012) but with DRN-to-caudate connectivity in the typical PD (r=-0.161, p=0.019). A similar association between the putamen volume and α-synuclein aggregation was detected, but only in patients with the DRN subtype (r=-0.445, p=0.004) not for the typical PD subtype. Our results suggest that patients having larger DRN volume or weakened serotonergic projections exhibit higher baseline dopamine levels, as a specific biomarker for the DRN subtype.
Secondly, subtype-specific drug effects were revealed that patients with the DRN subtype showed more profound treatment effects on motor symptoms compared to the typical PD (p-values<0.05 for UPDRS3, tremor and rigidity, Figure 5). We found that the drug effects on clinical symptoms (∆UPDRS) were negatively associated with baseline striatal dopamine levels (Figure 7B, r = -0.40 and -0.28, p-values < 0.001, respectively for the DRN and typical PD subtype). Moreover, in patients with the typical PD subtype, the longitudinal drug effects (averaging ∆UPDRS across 5-year follow-ups) were significantly predicted by baseline DRN-to-pre/postcentral connectivity (r=0.2494/0.2588, p=0.0004/0.0002, respectively). Such associations were not found in the DRN subtype. Instead, the drug effect on patients with the DRN subtype was associated with GMV of putamen (r=-0.3303, p=0.05). Our findings suggest that patients with lower baseline dopamine levels or richer DRN projections experienced greater reductions in clinical symptoms, or more pronounced medication effects, after taking PD medications.
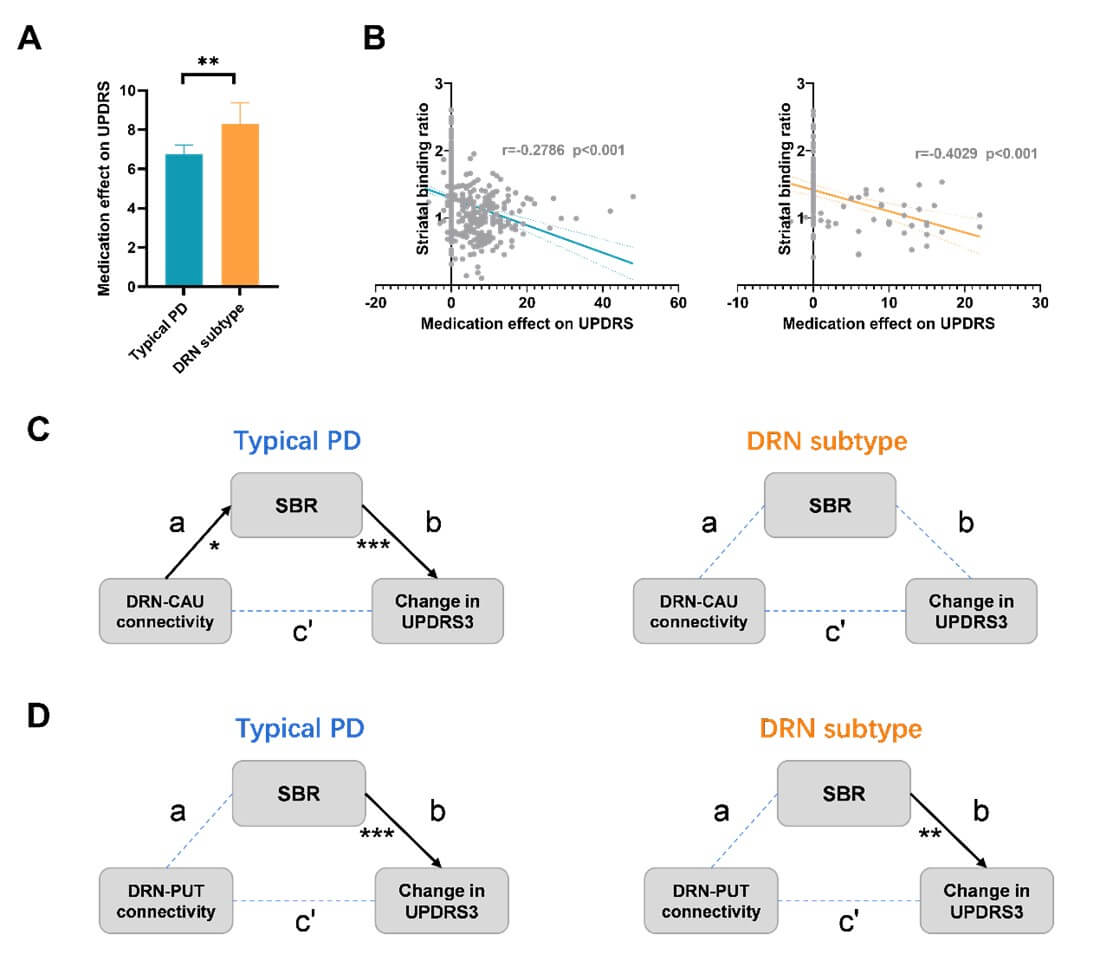
Thirdly, subtype-specific serotonergic regulations were identified by mediation analysis among DRN projections, dopamine levels and drug effects. In both subtypes, the drug effects on motor symptoms (∆UPDRS3) were regulated by DRN-to-striatal projections through indirect effects by modulating dopamine release. Yet, different pathways were endorsed in the two subtypes. Specifically, in patients with the DRN subtype, the drug effects (∆UPDRS3) were regulated by DRN-to-putamen connectivity and baseline dopamine levels (Figure 5C, indirect effect p-value=0.048). Whereas, in patients with the typical PD subtype, the drug effects (∆UPDRS3) were regulated by the DRN-to-caudate connectivity (Figure 5D, indirect effect p-value=0.029). Our results suggest that the DRN 5-HT neurons regulate the dopamine release and motor symptoms via different neurological pathways in the PD two subtypes.
In summary, patients with the DRN subtype not only exhibited less severe motor symptoms and higher concentration of CSF amyloid-β at baseline, but also demonstrated greater drug effects and better prognosis. Our study identified a specific subgroup of PD patients who were more responsive to anti-parkinsonian medications and had a lower risk of dementia and cognitive deficits during disease progression. These findings highlight the importance of subtype-specific diagnosis and personalized treatment of PD.
3.7. Neuroimaging–Transcription Association Analysis
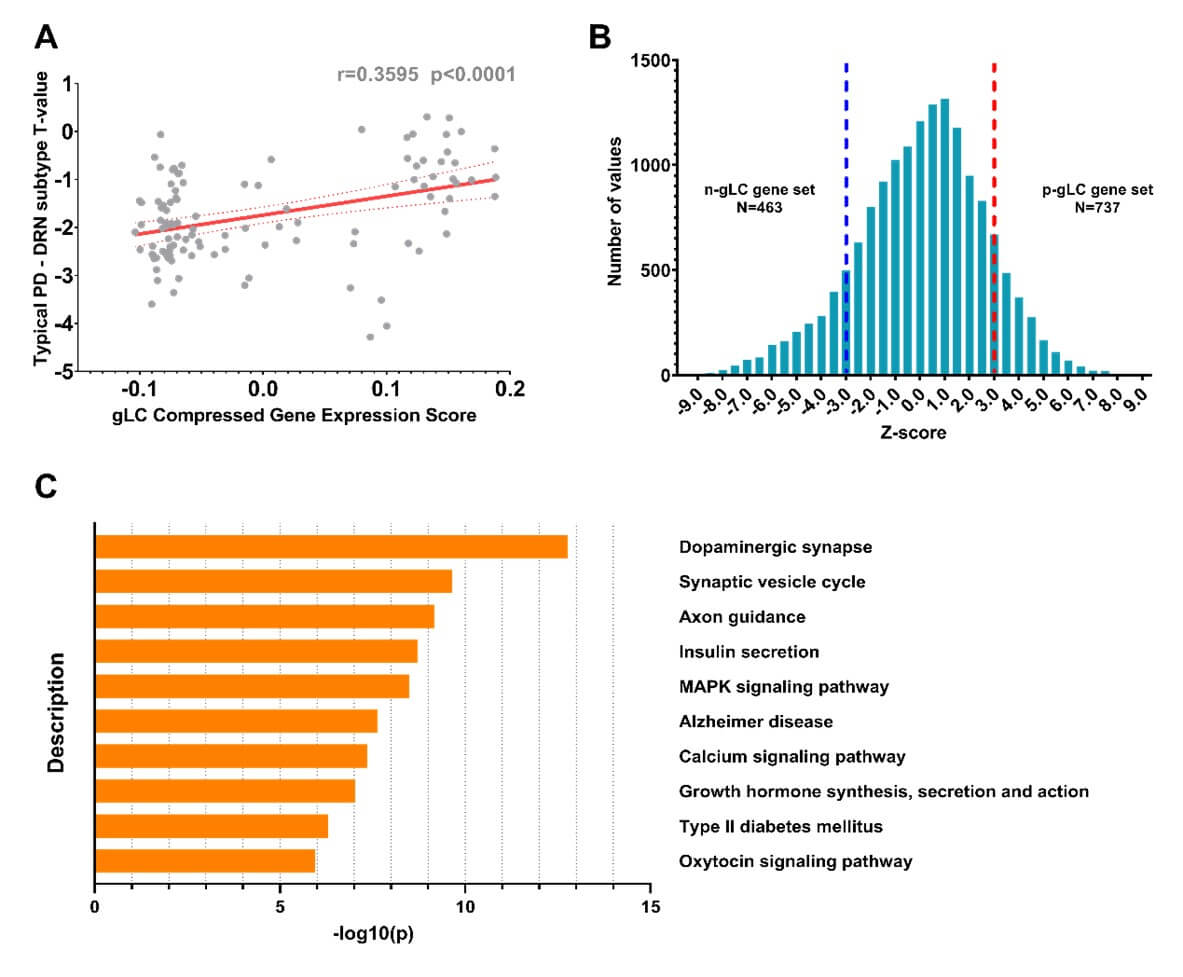
To investigate the biological pathways that differentiate between the two PD subtypes, we conducted the gene enrichment analyses using the Metascape toolbox. Firstly, we identified the genetic latent components (gLC) that strongly predicted PD-related brain atrophy (i.e., T map), and found a significant association between the gLC scores and subtype-specific atrophy patterns (r = 0.36, p < 0.001, Figure 8A), accounting for 16% of the variance (permuted p-value<0.05). Next, we estimated the normalized weights (Z-score) for each gene by performing the bootstrap resampling 1,000 times, and identified 463 significant genes that associated with larger cortical and subcortical volumes in patients with the DRN subtype (Z-score<-3). We then conducted the KEGG pathways enrichment analysis and revealed top 10 enriched pathways that were significantly associated with the subtype-specific atrophy patterns (FDR corrected p-value<0.001), including dopaminergic synaptic transmission (p-value=1.67e-13), axon guidance pathway (p-value=6.79e-10), the calcium signaling (p-value=2.33e-8), neurotransmitter secretion and growth hormone, as well as Alzheimer disease (p-value=4.39e-8), (Figure 8C).
4. Discussion
We proposed a connectivity-based subtyping approach of PD that measures patient-specific alteration of structural covariance networks compared to healthy controls. Compared to the clinical motor phenotypes of TD/PIGD, the proposed subtyping method exhibited a high stability in terms of the selection of healthy controls (acc=0.88), random sampling on PD patients (0.94), and longitudinal prediction of disease progression (0.91). We identified two distinct subtypes of de novo PD that exhibited distinct imaging features, clinical characteristics, biomarker profiles, and longitudinal progression patterns. Specifically, patients with the DRN subtype demonstrated larger striatal volumes, weakened serotonergic projections to cortical and striatal regions, less severe motor symptoms and higher concentrations of CSF amyloid-β at baseline. Subtype-specific drug effects, associations and mediations were also revealed. Greater drug effects of anti-parkinsonian treatment were found in patients with the DRN subtype and were regulated by DRN serotonergic and striatal dopaminergic neurons. In patients with the DRN subtype, the reduction of DRN serotonergic inputs demonstrated other subtype-specific benefits, including accelerating the aggregation of CSF biomarkers, delaying the conversion to more severe disease states, and preventing the development of non-motor symptoms and cognitive impairments. Our findings suggest that the DRN-predominant PD has a distinct neuropathology, where DRN 5-HT neurons regulated movement disorders and parkinsonism symptoms through serotonergic projections to striatal dopaminergic neurons. The discovery of the DRN subtype is particularly important for clinical practice including precision medicine and early interventions in PD, and may also accelerate the drug discovery process for PD.
Various PD subtypes have been identified based on clinical symptoms, disease onset, or tremor predominance. Data-driven approaches have shown great potentials in identifying subgroups of PD patients with distinct clinical characteristics and disease trajectories. Using a series of clinical characteristics and biomarkers, Fereshtehnejad and colleagues identified three subtypes of de novo PD patients and reported a distinctive subtype of PD, referred to as diffuse-malignant PD, characterized by greater decline in cognitive functions, dopamine levels and brain atrophy, as well as faster overall disease progression [8]. Motivated by the connectome-based hypothesis of Lewy pathology [11, 12], we proposed a connectivity-based subtyping method and identified two distinct subtypes of de novo PD based on their deviation of structural covariance networks. We uncovered a unique clinical and biological phenotype, (i.e., the DRN-predominant PD), that was characterized by reduced DRN-to-cortical/striatal connectivity and larger volumes of striatum and motor cortex. The DRN-predominant PD demonstrated an opposite trend in terms of clinical symptoms and imaging biomarkers as the diffuse-malignant PD, including less server motor symptoms at baseline compared to the other subtype, as well as higher concentration of CSF amyloid-β and dopamine levels during longitudinal progression. Importantly, the DRN subtype responds more effectively to anti-parkinsonian medications (Figure S9), especially in motor symptoms including UPDRS3, tremor and rigidity scores, which has not been reported in previous subtyping studies [6, 8-10]. Besides, we found that the drug effects of anti-parkinsonian treatment were associated with baseline dopamine levels in both subtypes, and regulated by direct (DRN-to-motor) and indirect (via DRN-to-striatal) DRN projections in patients with the typical PD subtype (Figure 7). To conclude, patients with the DRN subtype exhibited less severe motor symptoms and distinctive imaging biomarkers at baseline, including weakened serotonergic projections to cortical and striatal regions, larger brain volumes of the striatum and motor cortex, and higher aggregation of CSF amyloid-β. Our findings suggest that the DRN subtype may represent a distinct clinical and biological phenotype of de novo PD.
The discovery of the DRN subtype is of particular importance for clinical practice, such as developing new strategies for early diagnosis, intervention and personalized treatment for PD. Using massive univariate brain morphology analysis, a previous study identified two subtypes of PD that were associated with distinct patterns of brain atrophy [10]. The two subtypes showed similar baseline motor symptoms yet differed significantly in their non-motor symptoms and prognosis. Interestingly, the authors also reported larger striatal volumes in the subtype with mild clinical symptoms, which was consistent with our findings that patients with the DRN subtype had larger brain volumes of the substantia nigra, striatum and motor cortex, as compared to healthy controls (Figure 4B). In addition, we revealed subtype-specific associations of subcortical brain volumes that patients with larger volume of putamen exhibited lower concentration of α-synuclein (r=-0.445, p=0.004, Figure 4D) and lower drug efficiency (r=-0.3303, p=0.05, Figure S5A), and patients with larger volume of DRN showed higher dopamine levels at baseline (r=0.408, p=0.009). These associations were only present in patients with the DRN subtype. Our findings suggest that enriched 5-HT neurons and serotonergic transmitters in the DRN-predominant PD can prevent nigra cell loss and delay dopamine depletion, and eventually be more responsive to anti-parkinsonian treatment.
The interaction between serotonergic and dopaminergic systems has been widely reported in the literature where 5-HT neurons induced an inhibition of MSN in the striatum and regulated dopamine release [24, 25]. Accumulating evidences suggest that the serotonergic system is critically involved in the pathophysiology of PD, and more specifically serotonergic dysfunctions are known to be associated with the development of motor and non-motor symptoms in PD [26, 27]. For instance, serotonergic neurotransmission gradually decreased in more advanced disease stages of PD [28], and lesions of the DRN (or serotonergic neuron loss) prevented dopamine release after an acute L-DOPA injection [29]. This interaction between serotonergic and dopaminergic systems is known to be reciprocal that 5-HT levels also decrease after L-DOPA administration [30]. Consistent with this hypothesis, we observed subtype-specific associations of dopamine release with the DRN volumes/projections. Specifically, in patients with the DRN subtype, the striatal dopamine levels were positively associated with the DRN volume (r=0.408, p=0.009) and negatively associated with DRN-to-putamen/motor cortex connectivity (r=-0.314/-0.396, p=0.048/0.012).
In contrast, in patients with the typical PD subtype, we found a negative association of striatal dopamine levels with DRN-to-caudate connectivity (r=-0.161, p=0.019). Additionally, we uncovered subtype-specific regulations of clinical symptoms in the two PD subtypes. Studies have shown that 5-HT neurons had a prominent role in the regulation of motor and cognitive functions through its effects on the activity of basal ganglia circuits [24, 25]. Consistently, we found that, in patients with in the typical PD subtype, motor-related symptoms, including rigidity scores and autonomic dysfunctions, were positively associated with the DRN-to-putamen/motor cortex connectivity, while non-motor symptoms, such as anxiety, was associated with DRN-to-caudate connectivity. Yet, distinct associations were observed in patients with the DRN subtype that the cognitive decline and sleep disturbances were associated with DRN-to-DMN connectivity (Figure 3). We also found that the typical PD subtype showed significantly reduced MoCA scores relative to healthy controls both at baseline (p-value<0.0001) and longitudinal assessments (p-values<0.01). In contrast, the DRN-predominant subtype, while differing from healthy controls at baseline (p-value=0.014), did not demonstrate significant cognitive declines in the follow-up visits (p-values>0.5). This finding suggests a potential neuroprotective role of serotonin (5-HT) neurons within the DRN subtype in preserving cognitive functions, spanning motor, limbic, and cognitive domains. A similar functional subdivision of dopaminergic projections has been revealed for SN [31].
The heterogeneity of DRN 5-HT neurons has been widely reported in animal studies in terms of distinct molecular and anatomical architectures, varied genetic expressions and axonal projections [24, 32-34]. For instance, the 5-HT neurons projecting to striatum and motor cortex were largely segregated into the dorsal and ventral DRN respectively [24]. Even the striatal-projecting 5-HT neurons are heterogenous as well, consisting of at least 2 distinct molecular subtypes [24]. For instance, the 5-HT neurons projecting to putamen/caudate were mostly located in the anterior part, while the neurons projecting to nuclear accumbens located in posterior parts of DRN [24]. Our results also suggest a functional segregation of DRN-to-striatal projections in PD patients that the dopamine release was regulated by DRN projects to caudate and putamen respectively in the two PD subtypes (Figure S4). Such segregation was observed even within the DRN subtype that the aggregation of CSF amyloid-β was associated with DRN-to-caudate connectivity (Figure S3) and the propagation of α-synuclein pathology was associated with the volume of putamen (Figure 4D). Moreover, we found that the drug effects on motor symptoms (∆UPDRS) were regulated by baseline dopamine levels in both subtypes but via distinct neurological pathways (Figure 7). Specifically, we uncovered that the drug effects of the typical PD subtype were regulated by both direct (DRN-to-motor cortex, Figure S5) and indirect (via DRN-to-striatal) serotonergic pathways (Figure 7), suggesting the involvement of two different pathways. Nonetheless, the impact of the indirect pathway through DRN-to-striatal projection and dopaminergic modulation was more prominent in the DRN subtype (Figure 7). The KEGG pathways enrichment analysis also confirmed that the differential atrophy patterns in the two subtypes were specifically associated with dopaminergic synaptic transmission and axon guidance pathway, as well as the neurotransmitter secretion (Figure 8). This finding may explain the higher drug effects in the DRN subtype after taking the levodopa and other related anti-parkinsonian medications.
Together, our study revealed a critical role of serotonergic projections from the dorsal raphe nucleus (DRN) to the striatum and cerebral cortex in modulating dopamine release, cerebrospinal fluid (CSF) biomarkers, and motor symptoms in Parkinson’s Disease (PD). We delineated a distinct DRN-predominant subtype of de novo PD characterized by enhanced responsiveness to anti-parkinsonian treatments and a more favorable disease trajectory. Our subtyping approach, validated by high stability across both healthy and PD populations (accuracy=0.88 and 0.94, respectively), suggests that the subtyping outcomes are robust and not merely artifacts of outliers or significant population variances. Crucially, this subtyping not only demonstrates consistent longitudinal prediction as disease progresses (average accuracy=0.91), but also significantly surpasses conventional motor phenotypes of TD/PIGD (accuracy=0.73) and prior neuroimaging-based approaches (accuracy=0.84).
Several considerations regarding the limitations of this study should be acknowledged. Firstly, the PPMI dataset exhibits varying degrees of missing data across its clinical, imaging, and biological samples in the longitudinal assessments, which could potentially influence the outcomes. Secondly, the findings from the PPMI dataset require further validation using additional cross-sectional clinical datasets. Lastly, the proposed subtyping method should be applied with caution in clinical settings. This approach measures each patient's deviation from the reference SCN established in healthy controls. The selection of healthy controls may impact the scoring and subtyping results. We have addressed the stability of this approach by employing random sampling of healthy controls and PD patients, but we do recommend constructing the reference SCN using a larger sample of healthy controls (ideally over 100 subjects) to ensure robustness.
5. Conclusion
This study revealed two distinct subtypes of de novo PD based on alterations in DRN connectivity. The two subtypes differ significantly in clinical manifestations, imaging biomarkers, treatment effects and prognoses. Specifically, we identified a unique subtype of PD, the DRN-predominant PD, that was characterized by reduced DRN-to-cortical/striatal connectivity, larger striatal volumes, less severe motor symptoms at baseline, and greater drug effects on motor symptoms. The treatment effects were also regulated by DRN 5-HT neurons through their serotonergic projections to striatum. Our findings suggest a distinct clinical and biological phenotype for patients with the DRN subtype, along the atypical neuropathological pathway affected by serotonergic modulation on striatal dopaminergic neurons. Our study opens new avenues to precision medicine and personalized treatments in PD and other neurodegenerative diseases.
Acknowledgements
Part of the data used in the preparation of this article were obtained from the Parkinsons progression markers initiative (PPMI) database (http://www.ppmi-info.org/access-data-specimens/download-data). For up-to-date information on the study, visit (https://www.ppmi-info.org/). PPMI a public-private partnership is funded by the Michael J. Fox Foundation for Parkinsons Research and funding partners [listed in (https://www.ppmi-info.org/about-ppmi/who-we-are/study-sponsors)].
Funding
This work was partially supported by the STI2030-Major Projects 2021ZD0200201, 2022ZD0211500, the National Natural Science Foundation of China (Grants Nos. 62201519, 52307259, 62327805, 82151307).
REFERENCES
[1] Morgane Prime, J Lucas McKay, Allison
A Bay, et al. “Differentiating Parkinson Disease Subtypes Using Clinical
Balance Measures.” J Neurol Phys Ther, vol. 44, no. 1, pp. 34-41, 2020.
View at: Publisher
Site | PubMed
[2] Stephanie M van Rooden, Fabrice
Colas, Pablo Martínez-Martín, et al. “Clinical subtypes of Parkinson’s
disease.” Mov Disord, vol. 26, no. 1, pp. 51-58, 2011. View at: Publisher Site | PubMed
[3] Mary Ann Thenganatt, Joseph Jankovic
“Parkinson Disease Subtypes.” JAMA Neurol, vol. 71, no. 4, pp. 499-504,
2014. View at: Publisher
Site | PubMed
[4] Brianne Mohl, Brian D Berman, Erika
Shelton, et al. “Levodopa response differs in Parkinson’s motor subtypes: A
task-based effective connectivity study.” J Comp Neurol, vol. 525, no.
9, pp. 2192-2201, 2017. View at: Publisher
Site | PubMed
[5] Thuy C Vu, John G Nutt, Nicholas H G
Holford “Progression of motor and nonmotor features of Parkinson’s disease and
their response to treatment.” Br J Clin Pharmacol, vol. 74, no. 2, pp.
267-283, 2012. View at: Publisher Site | PubMed
[6] Stephanie M van Rooden, Willem J
Heiser, Joost N Kok, et al. “The identification of Parkinson’s disease subtypes
using cluster analysis: A systematic review.” Mov Disord, vol. 25, no.
8, pp. 969-978, 2010. View at: Publisher
Site | PubMed
[7] Dana Pourzinal, Jihyun Yang, Rachael
A Lawson, et al. “Systematic review of data‐driven cognitive subtypes in
Parkinson disease.” Eur J Neurol, vol. 29, no. 1, pp. 3395-3417, 2022. View at: Publisher Site | PubMed
[8] Seyed-Mohammad Fereshtehnejad, Yashar
Zeighami, Alain Dagher, et al. “Clinical criteria for subtyping Parkinson’s
disease: Biomarkers and longitudinal progression.” Brain, vol. 140, no.
7, pp. 1959-1976, 2017. View at: Publisher
Site | PubMed
[9] Jacopo Pasquini, Roberto Ceravolo,
Zahi Qamhawi, et al. “Progression of tremor in early stages of Parkinson’s
disease: A clinical and neuroimaging study.” Brain, vol. 141, no. 3, pp.
811-821, 2018. View at: Publisher
Site | PubMed
[10] Linbo Wang, Wei Cheng, Edmund T
Rolls, et al. “Association of specific biotypes in patients with Parkinson
disease and disease progression.” Neurology, vol. 95, no. 11, pp.
E1445-E1460, 2020. View at: Publisher Site | PubMed
[11] Heiko Braak, Kelly Del Tredici, Udo
Rüb, et al. “Staging of brain pathology related to sporadic Parkinson’s
disease.” Neurobiol Aging, vol. 24, no. 2, pp. 197-211, 2003. View at: Publisher Site | PubMed
[12] Michel Goedert, Maria Grazia
Spillantini, Kelly Del Tredici, et al. “100 years of Lewy pathology.” Nat
Rev Neurol, vol. 9, no. 1, pp. 13-24, 2013. View at: Publisher Site | PubMed
[13] Michael X Henderson, Eli J Cornblath,
Adam Darwich, et al. “Spread of α-synuclein pathology through the
brain connectome is modulated by selective vulnerability and predicted by
network analysis.” Nat Neurosci, vol. 22, no. 8, pp. 1248-1257, 2019.
View at: Publisher
Site | PubMed
[14] Kelvin C Luk, Victoria Kehm, Jenna
Carroll, et al. “Pathological α-synuclein transmission initiates Parkinson-like
neurodegeneration in nontransgenic mice.” Science, vol. 338, no. 6109, pp. 949-953,
2012. View at: Publisher
Site | PubMed
[15] S Pandya, Y Zeighami, B Freeze, et
al. “Predictive model of spread of Parkinson’s pathology using network
diffusion.” Neuroimage, vol. 192, pp. 178-194, 2019. View at: Publisher Site | PubMed
[16] Yashar Zeighami, Miguel Ulla, Yasser
Iturria-Medina, et al. “Network structure of brain atrophy in de novo
Parkinson’s disease.” Elife, vol. 4, pp. e08440, 2015. View at: Publisher Site | PubMed
[17] Ying-Qiu Zheng, Yu Zhang, Yvonne Yau,
et al. “Local vulnerability and global connectivity jointly shape
neurodegenerative disease propagation.” PLoS Biol, vol. 17, no. 11, pp.
e3000495, 2019. View at: Publisher
Site | PubMed
[18] Kenneth Marek, Danna Jennings,
Shirley Lasch, et al. “The Parkinson Progression Marker Initiative (PPMI)” Prog
Neurobiol, vol. 95, no. 4, pp. 629-635, 2011. View at: Publisher Site | PubMed
[19] Edmund T Rolls, Chu-Chung Huang,
Ching-Po Lin, et al. “Automated anatomical labelling atlas 3.” Neuroimage,
vol. 206, pp. 116189, 2020. View at: Publisher Site | PubMed
[20] Zhaowen Liu, Lena Palaniyappan, Xinran
Wu, et al. “Resolving heterogeneity in schizophrenia through a novel systems
approach to brain structure: individualized structural covariance network
analysis.” Mol Psychiatry, vol. 26, no. 12, pp. 7719-7731, 2021. View
at: Publisher
Site | PubMed
[21] Tor D Wager, Matthew L Davidson,
Brent L Hughes, et al. “Prefrontal-Subcortical Pathways Mediating Successful
Emotion Regulation.” Neuron, vol. 59, no. 6, pp. 1037-1050, 2008. View
at: Publisher
Site | PubMed
[22] Michael J Hawrylycz, Ed S Lein,
Angela L Guillozet-Bongaarts, et al. “An anatomically comprehensive atlas of
the adult human brain transcriptome.” Nature, vol. 489, no. 7416, pp.
391-399, 2012. View at: Publisher
Site | PubMed
[23] Yingyao Zhou, Bin Zhou, Lars Pache,
et al. “Metascape provides a biologist-oriented resource for the analysis of
systems-level datasets.” Nat Commun, vol. 10, no. 1, pp. 1523, 2019.
View at: Publisher
Site | PubMed
[24] Kee Wui Huang, Nicole E Ochandarena,
Adrienne C Philson, et al. “Molecular and anatomical organization of the dorsal
raphe nucleus.” Elife, vol. 8, pp. e46464, 2019. View at: Publisher Site | PubMed
[25] Cristina Miguelez, Teresa
Morera-Herreras, Maria Torrecilla, et al. “Interaction between the 5-HT system
and the basal ganglia: functional implication and therapeutic perspective in
Parkinson’s disease.” Front Neural Circuits, vol. 8, pp. 21, 2014. View
at: Publisher Site | PubMed
[26] Marios Politis, Clare Loane
“Serotonergic Dysfunction in Parkinson’s Disease and Its Relevance to
Disability.” ScientificWorldJournal, vol. 11, pp. 1726-1734, 2011. View
at: Publisher Site | PubMed
[27] Marios Politis, Flavia Niccolini, et
al. “Serotonin in Parkinson’s disease.” Behav Brain Res, vol. 277, pp.
136-145, 2015. View at: Publisher
Site | PubMed
[28] T H Haapaniemi, A Ahonen, P
Torniainen, et al. “[123I]β-CIT SPECT demonstrates decreased brain dopamine and
serotonin transporter levels in untreated parkinsonian patients.” Mov Disord, vol. 16, no. 1,
pp. 124-130, 2001. View at: Publisher
Site | PubMed
[29] Branden J Stansley, Bryan K Yamamoto
“L-Dopa and Brain Serotonin System Dysfunction.” Toxics, vol. 3, no. 1,
pp. 75-88, 2015. View at: Publisher
Site | PubMed
[30] Branden J Stansley, Bryan K Yamamoto
“Chronic l-Dopa Decreases Serotonin Neurons in a Subregion of the Dorsal Raphe
Nucleus.” J Pharmacol Exp Ther, vol. 351, no. 2, pp. 440-447, 2014. View
at: Publisher Site | PubMed
[31] Yu Zhang, Kevin Michel-Herve Larcher,
Bratislav Misic, et al. “Anatomical and functional organization of the human
substantia nigra and its connections.” Elife, vol. 6, pp. e26653, 2017.
View at: Publisher Site | PubMed
[32] Lyngine H Calizo, Adaure Akanwa,
Xiaohang Ma, et al. “Raphe serotonin neurons are not homogenous:
electrophysiological, morphological and neurochemical evidence.” Neuropharmacology,
vol. 61, no.3, pp. 524-543, 2011. View at: Publisher Site | PubMed
[33] Matthew W Hale, Christopher A Lowry “Functional topography of midbrain and pontine serotonergic systems: implications for synaptic regulation of serotonergic circuits.” Psychopharmacology (Berl), vol. 213, no. 2-3, pp. 243-264, 2011. View at: Publisher Site | PubMed
[34] Jing Ren, Drew Friedmann, Jing Xiong, et al. “Anatomically Defined and Functionally Distinct Dorsal Raphe Serotonin Sub-systems.” Cell, vol. 175, no. 2, pp. 472-487.e20, 2018. View at: Publisher Site | PubMed