Received: Fri 19, Apr 2024
Accepted: Thu 09, May 2024
Abstract
Microglial activation contributes to neurological disorders like Parkinson’s disease (PD), and modulating this activation is a potential therapeutic approach. The neuron-restrictive silencer factor (NRSF) functions as a negative regulator of gene transcription through epigenetic modifications. While previous research has primarily examined the role of NRSF in neuronal differentiation and injury, emerging evidence indicates that NRSF also plays a significant role in maintaining the phenotype of glial cells. In this study, we explored the role and underlying mechanisms of NRSF in lipopolysaccharide (LPS)-induced pro-inflammatory or interleukin-4 (IL4)-induced anti-inflammatory phenotype of microglial activation. Following LPS stimulation, the nuclear localization of NRSF increased in BV2 microglial cells, primary mouse microglia, and microglia within the substantia nigra of PD mice. Knockdown of NRSF enhanced the expression of inflammation-related factors induced by LPS via the mitogen-activated protein kinase-extracellular signal-regulated kinase (MAPK-ERK) and nuclear factor-κB (NF-κB) p65 signalling pathways in BV2 cells. Moreover, the culture medium from LPS-treated NRSF knockdown BV2 cells exerted greater toxic effects on human neuroblastoma SH-SY5Y cells compared to the control. However, NRSF knockdown exerted inconsistent effects on the expression of anti-inflammatory-related genes in IL4-treated BV2 cells. Our findings suggest that NRSF knockdown promotes microglial pro-inflammatory activation.
Keywords
NRSF, microglia, inflammation, LPS, IL4
1. Introduction
Parkinson's disease (PD) is a common neurodegenerative disease. Its major pathological changes are progressive degeneration of dopaminergic neurons in the nigrostriatal pathway and neuroinflammation mainly mediated by activated microglia and astrocytes [1, 2]. The etiology and pathological mechanism of Parkinson's disease are still not fully understood.
Neuron-restrictive silencer factor (NRSF)/repressor element-1 silencing transcription factor (REST) is a transcriptional repressor that binds to specific DNA sequences in gene promoters and recruits corepressor complexes to silence the expression of target genes like D3 dopamine receptors, SNAP25, and SCG10 through chromatin remodelling and histone deacetylation [3]. As a primary regulator of neural gene expression, NRSF is crucial for maintaining cell identity and proper neurodevelopment [4]. Altered NRSF expression or localization may impact neuronal survival in various brain diseases, including cerebral ischemia, Huntington’s disease, and epilepsy [5, 6]. Previous research has linked NRSF disturbances to cell viability in Parkinson’s disease (PD) cell models, and NRSF neuronal conditional knockout mice have shown increased sensitivity to the dopaminergic neurotoxin MPTP [7-10]. Additionally, NRSF has been found in Lewy bodies, and the loss of nuclear NRSF may be associated with PD pathology, suggesting its involvement in the degeneration of dopaminergic neurons in PD [11]. NRSF also plays a significant role in the differentiation, maturation, and functional regulation of astrocytes and oligodendrocytes [12, 13]. However, the function of NRSF in microglia remains unclear.
Microglia play an important role in neuroinflammation [14]. When the central nervous system (CNS) gets injured or infected, microglia are activated immediately and generate a series of inflammatory factors. Regulation of microglial activation might be a potential treatment strategy for PD [15, 16]. Microglia can assume distinct functional states, with LPS-induced activation promoting a pro-inflammatory profile and IL-4-induced activation promoting an anti-inflammatory profile [17-22].
In the present study, we investigated the expression and nuclear localization of NRSF in BV2 microglial cells stimulated with LPS or IL-4. We found that under LPS or IL-4 stimulation, the nuclear distribution of NRSF increased and the NRSF protein levels decreased in microglia respectively, and NRSF knockdown promoted pro-inflammatory activation through MAPK-ERK and NF-κB (p65) signalling. These results indicate that NRSF plays a negative role in the activation of pro-inflammatory microglia.
2. Materials and Methods
2.1. Cell Culture and Establishment of Stable NRSF Knockdown BV2 Cell Lines
The immortalized murine microglia cell line BV2 and human neuroblastoma SH-SY5Y cells were cultured in DMEM (Gibco, Grand Island, NY) with 10% fetal bovine serum (Gibco) at 37°C in a humidified incubator with 5% CO2. We constructed a pcDNA3.1-shRNA plasmid that effectively targets the mouse NRSF mRNA sequence (positions 1377 - 1395, NM_011263.2), and transfected this plasmid or pcDNA3.1 (as a control) plasmid into BV2 cells. To obtain stable NRSF knockdown BV2 cell lines, we screened the transfected BV2 cell lines by G418. LPS (100 ng/ml, Sigma-Aldrich, USA) and IL4 (10 ng/ml, Sigma-Aldrich, USA) were used to induce pro-inflammatory and anti-inflammatory activation, respectively, with phosphate-buffered saline (PBS) acting as the control.
2.2. Primary Microglia Culture
Newborn C57BL/6J mice (1-day-old) were sacrificed and dissected out the brains. The meninges and blood vessels were carefully removed from the brains in ice-cold Hanks’ balanced salt solution (HBSS). These brain tissues were cut into small pieces, digested with 0.25% trypsin (Invitrogen, CA, USA) and added the Dulbecco’s modified eagle medium (DMEM) containing 10% fetal bovine serum (FBS) and 1% penicillin-streptomycin to obtain a single cell suspension. The cells were seeded into poly-D-lysine-coated 75 cm2 flask and cultured for 12-14 days in a 37°C incubator with 5% CO2. The medium was changed every 3 days. To detach the microglial cells, we used the mild trypsinization method [23] and used microglial marker Iba1 for immunofluorescence staining identification.
2.3. Establishment of PD Mouse Model by Stereotaxic Injection of LPS into the Substantia Nigra
12-week-old C57BL/6 mice (Shanghai Research Center for Model Organisms, China) were bred in a room maintained at 20-22 °C with a 12 h light/dark cycle and with food and water available freely. Under isoflurane anaesthesia, LPS (1µg in 0.5µl sterile saline) or 0.5µl sterile saline (as control) was slowly injected into the bilateral substantia nigra of mice through Hamilton syringe fixed on a stereotaxic apparatus (RWD, China). The stereotaxic injection sites were: 2.9 mm AP, ±1.3 mm ML and 4.5 mm DV from bregma. Three days after the injection, the mice were anaesthetized and perfused with normal saline and 4% paraformaldehyde. The brain was dissected out and dehydrated and sliced. The animal experiment protocols were approved by the Animal Care and Use Committee of Fudan University, and all efforts were made to minimize adverse effects.
2.4. Real-Time Quantitative Polymerase Chain Reaction (qPCR)
Total RNA was extracted from cells using TRNzol Universal (Tiangen Biotech, Beijing, China) according to the manufacturer’s instructions. 2μg of RNA was reverse transcribed using FastKing gDNA Dispelling RT SuperMix (Tiangen Biotech). qPCR was performed for quantitative analysis of IL1β, iNOS, TNFα, IL6, IL10, FIZZ1, TGFβ2, Arginase-1 (Arg1) and β-actin (as internal control) mRNA expression using SuperReal PreMix Plus with SYBR Green (Tiangen Biotech) in a Mastercycler gradient real-time PCR system (Eppendorf, Germany). Relative gene expression was calculated by the 2-ΔΔCT method. The primer sequences used for the above genes are listed in (Table 1).
Table 1.
Primer sequences for qPCR.
|
Gene |
Primer
Sequence |
Product
Length |
|
IL1β
iNOS
TNFa
IL6
IL10
FIZZ1
TGFβ2
Arg1
β-actin
|
forward: 5’-TCCAGCTTCAAATCTCGCAG-3’ reverse: 5’-TGTAGTGCAGTTGTCTAATGGG-3’ forward: 5’-CCCTTCCGAAGTTTCTGGCAGCAGC-3’ reverse: 5’-GGCTGTCAGAGCCTCGTGGCTTTGG-3’ forward: 5’-CATCTTCTCAAAATTCGAGTGACAA-3’ reverse: 5’-ACTTGGGCAGATTGACCTCAG-3’ forward: 5’- CCTACCCCAATTTCCAATGCT-3’ reverse: 5’- TATTTTCTGACCACAGTGAGGAAT-3’ forward: 5’-GGCTCAGCACTGCTATGC-3’ reverse: 5’-CAGGGAATTCAAATGCTCC-3’ forward: 5’-GAATAGGATGAAGACTAC-3’ reverse: 5’-CAGTCAACGAGTAAGCAC-3’ forward: 5’-CTTCAGAATCGTCCGCTTTG-3’ reverse: 5’-GACGGCACGAAGGTACAGCAG-3’ forward: 5’-GCAGCACTGAGGAAAGCTGG-3’ reverse: 5’-GACACAGGTTGCCCATGCAG-3’ forward: 5’-CAGGATGCAGAAGGAGATTAC-3’ reverse: 5’-AACGCAGCTCAGTAACAGTC-3’ |
237bp
496bp
411bp
201bp
330bp
311bp
349bp
352bp
218bp
|
2.5. Protein Extraction and Western Blot Analysis
Cells or midbrain tissue were lysed in RIPA lysis and extraction buffer (Thermo Scientific™) containing complete protease inhibitor cocktail (78430, Thermo Scientific™). For the extraction of phosphorylated proteins, phosphatase inhibitors cocktail (B15001, Bimake) was added additionally. Extracted protein samples were separated by 8% or 10% sodium dodecyl sulphate-polyacrylamide gel electrophoresis and transferred immediately onto PVDF transfer membranes (Merck Millipore). The membranes were blocked in 5% non-fat dried milk in TBST (137 mM NaCl, 20 mM Tris-HCl, 0.1% Tween-20, pH 7.6). Then, the membranes were incubated with primary antibodies: anti-NRSF (1:1000, NOVUS), anti-β-actin (1:2000, Santa Cruz), anti-iNOS (1:500, Abcam), anti-COX2 (1:1000, Abcam), anti-p-ERK (1:1000, Selleck), anti-p-JNK (1:1000, CST), anti-p-p65 (1:1000, CST), or anti-TH (1:1000, Abcam). After washing, the membranes were hybridized with fluorescein-coupled secondary antibodies (LI-COR, USA, 1:20000). The membranes were washed with TBST again. Finally, the specific immunoreactive protein bands on the membranes were detected with Odyssey infrared imaging system (Li-Cor, USA). The protein levels were quantified by densitometry analysis using Quantity One 4.5.2 software (Bio-Rad, Hercules, USA).
2.6. Immunofluorescence Staining
Cells were seeded on coverslips and cultured for 24h. After stimulation, the cells were fixed for 10 min with 4% paraformaldehyde in PBS and washed with PBS. Fixed cells were blocked in PBS containing 0.2% Triton X-100 and 10% goat serum and incubated in primary antibodies: anti-NRSF (1:500, Abcam), Arg1 (1:10000, Merck) or anti-Iba1 (1:1000, Wako, Japan) for 1 hour. After washing, cells were incubated with secondary antibodies (1:1000, Invitrogen), washed again, and counterstained with DAPI (1:1000, Thermo Fisher). Coverslips were mounted in glass slides. Fluorescent photographs were taken using confocal laser scanning microscopy (TCS SP2, Leica, Germany). Image-Pro Plus6.0 software was used to analyze the fluorescent intensity. The immunofluorescence staining procedure of brain slices was similar to that of cells.
2.7. Detection of Nitrite in Cell Culture Medium
Detection of nitrite in cell culture medium by Griess agent could reflect the NO released by cells. After the BV2 cells were treated with LPS or PBS for 24h, the culture supernatant was added Griess reagent (Beyotime, China) according to manufacturer’s instructions and the absorbance at 540 nm was measured on a microplate spectrophotometer reader. Nitrite concentrations were calculated according to the standard curve of NaNO2.
2.8. Cell Viability Assay
BV2 cells were stimulated with LPS for 24h and the culture medium was collected. The culture medium was used to stimulate SH-SY5Y cells seeded in 96 well plates (1 × 10⁴ cells/well). After 48h, cell viability of the SH-SY5Y cells was determined by using Cell Counting Kit-8 (Beyotime, China) according to the manufacturer's instructions.
2.9. Statistical Analysis
Data were expressed as mean ± SEM and analyzed by two-tailed Student’s T-test for two groups or one-way ANOVA followed by LSD for multiple groups using Prism 6.0 software (GraphPad Software, San Diego, USA). P<0.05 was considered as statistically significant.
3. Results
3.1. LPS Stimulation Increased Nuclear Localization of NRSF in BV2 Cells
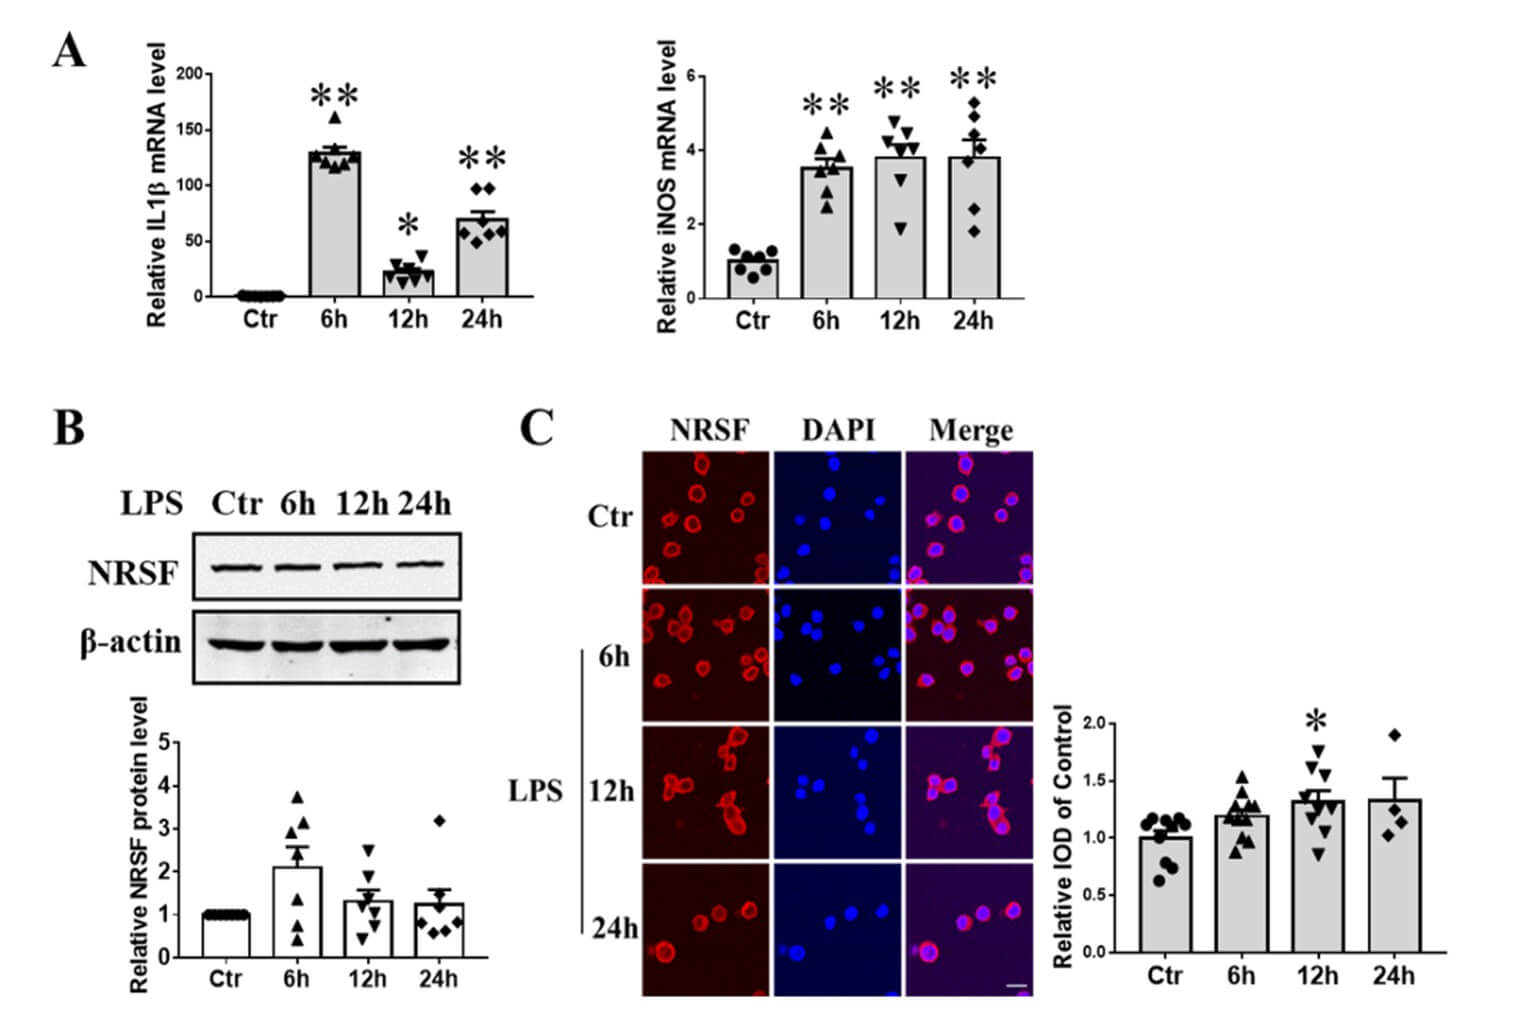
To confirm the pro-inflammatory activation of BV2 microglial cells, we performed qPCR to measure the expression of IL1β and iNOS mRNA following treatment with 100 ng/ml LPS for 6, 12, and 24 hours. Both IL1β and iNOS transcripts showed a significant increase, indicating a pro-inflammatory state (Figure 1A). To evaluate the effect of LPS on NRSF expression, we conducted western blot analysis to examine NRSF protein levels at the same time points following LPS treatment, and found that NRSF protein expression remained relatively constant (Figure 1B). NRSF plays its role in the nucleus as a transcription factor. Therefore, immunofluorescence confocal imaging was performed to investigate the subcellular localization of NRSF after the same LPS treatment. By immunofluorescence staining with the anti-NRSF antibody (red), we demonstrated that NRSF was mainly located in the cytosol of BV2 cells at normal culture condition. After LPS treatment for 12h, NRSF partially delocalized from the cytosol to the nucleus (Figure 1C).
3.2. NRSF Knockdown Increased the Expression of Pro-Inflammation Factors in LPS-Stimulated BV2 Cells
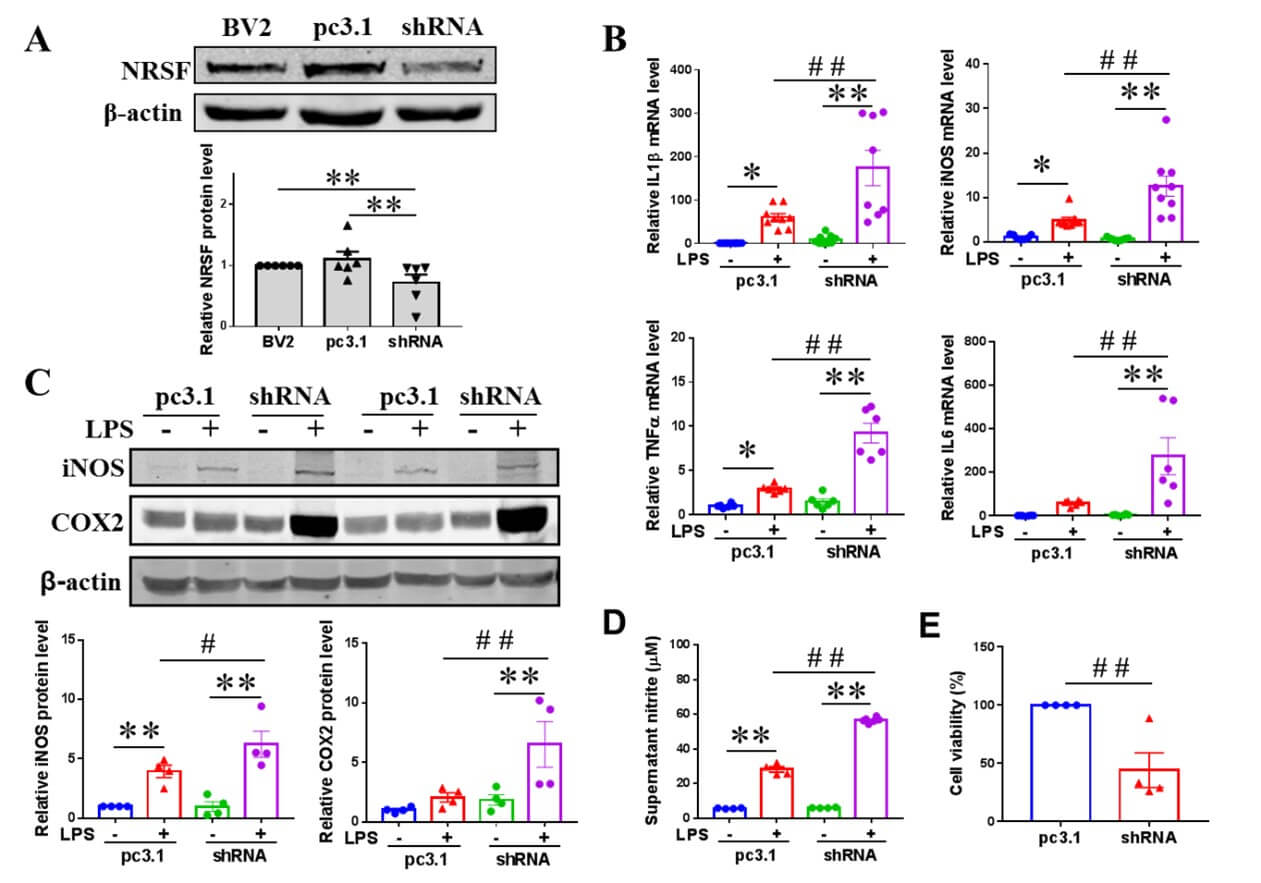
To investigate the impact of NRSF knockdown on LPS-induced pro-inflammatory gene expression, we transfected BV2 cells with the plasmid pcDNA3.1-shRNA targeting NRSF or with pcDNA3.1 (as a control). We established stable transfected cell lines through subsequent G418 selection. Western blot results showed that the protein expression of NRSF was efficiently knocked down in the BV2 cells transfected with pcDNA3.1-shRNA (Figure 2A). qPCR analysis of pro-inflammation cytokine expression was performed in LPS-treated control and NRSF-knockdown BV2 cells. As shown, NRSF knockdown further increased IL1β, iNOS, TNFα and IL6 mRNA expression in BV2 cells stimulated with LPS for 6h (Figure 2B). We also examined the effects of NRSF knockdown on the protein expression of iNOS and COX2 in LPS-treated cells by western blot. After LPS stimulation for 12h, the protein expression of iNOS was significantly increased in pcDNA3.1 or pcDNA3.1-shRNA BV2 cells. The protein expression of COX2 in pcDNA3.1 (p=0.0412 vs PBS control by two-tailed Student’s T-test) or pcDNA3.1-shRNA BV2 cells induced by LPS was also remarkably elevated. However, the protein expression of iNOS and COX2 in pcDNA3.1-shRNA group was significantly higher than that in pcDNA3.1 group after LPS stimulation for 12h (Figure 2C). As increased expression of iNOS promotes NO production, we detected the NO release in the culture medium of pcDNA3.1 or pcDNA3.1-shRNA BV2 cells after LPS or PBS stimulation for 24h. Consistent with the above results, the nitrite content of the pcDNA3.1-shRNA group was significantly higher compared to the pcDNA3.1 group after LPS treatment (Figure 2D). Moreover, we investigated toxic effects of the supernatants from LPS-treated control and NRSF-knockdown BV2 cells. After culturing human neuroblastoma SH-SY5Y cells for 48h with the conditioned medium from the pcDNA3.1-shRNA group treated with LPS, the cell viability decreased significantly compared with the pcDNA3.1 group (Figure 2E).
3.3. NRSF Knockdown Promoted MAPK-ERK and NF-κB (p65) Signalling in LPS-Induced BV2 Cells
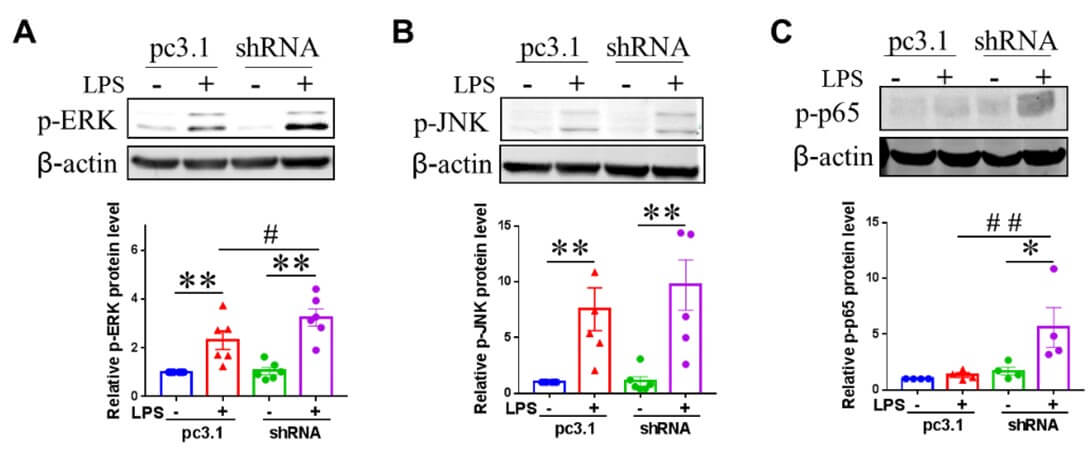
LPS activates microglia through MAPK signalling pathways, including ERK, JNK, and p38, as well as the NF-κB signalling cascade [24]. To investigate the molecular mechanisms by which NRSF knockdown enhances pro-inflammatory microglial activation in BV2 cells, we assessed the activation of ERK, JNK, p38, and p65 in BV2 cells stimulated with LPS for 45 minutes. As shown in (Figure 3), the phosphorylation protein levels of ERK and JNK in BV2 cells were significantly increased after LPS stimulation. NRSF knockdown further upregulated the phosphorylated protein level of ERK (Figure 3A), and increased p65 protein phosphorylation in LPS-treated cells (Figure 3C), while the phosphorylation levels of JNK (Figure 3B) and p38 (data not shown) proteins were not affected in BV2 cells induced by LPS. The protein expression of ERK, JNK, and p65 of NF-κB was not affected by LPS stimulation or NRSF knockdown (data not shown).
3.4. Decrease of NRSF Protein Expression in IL4-Induced BV2 Cells
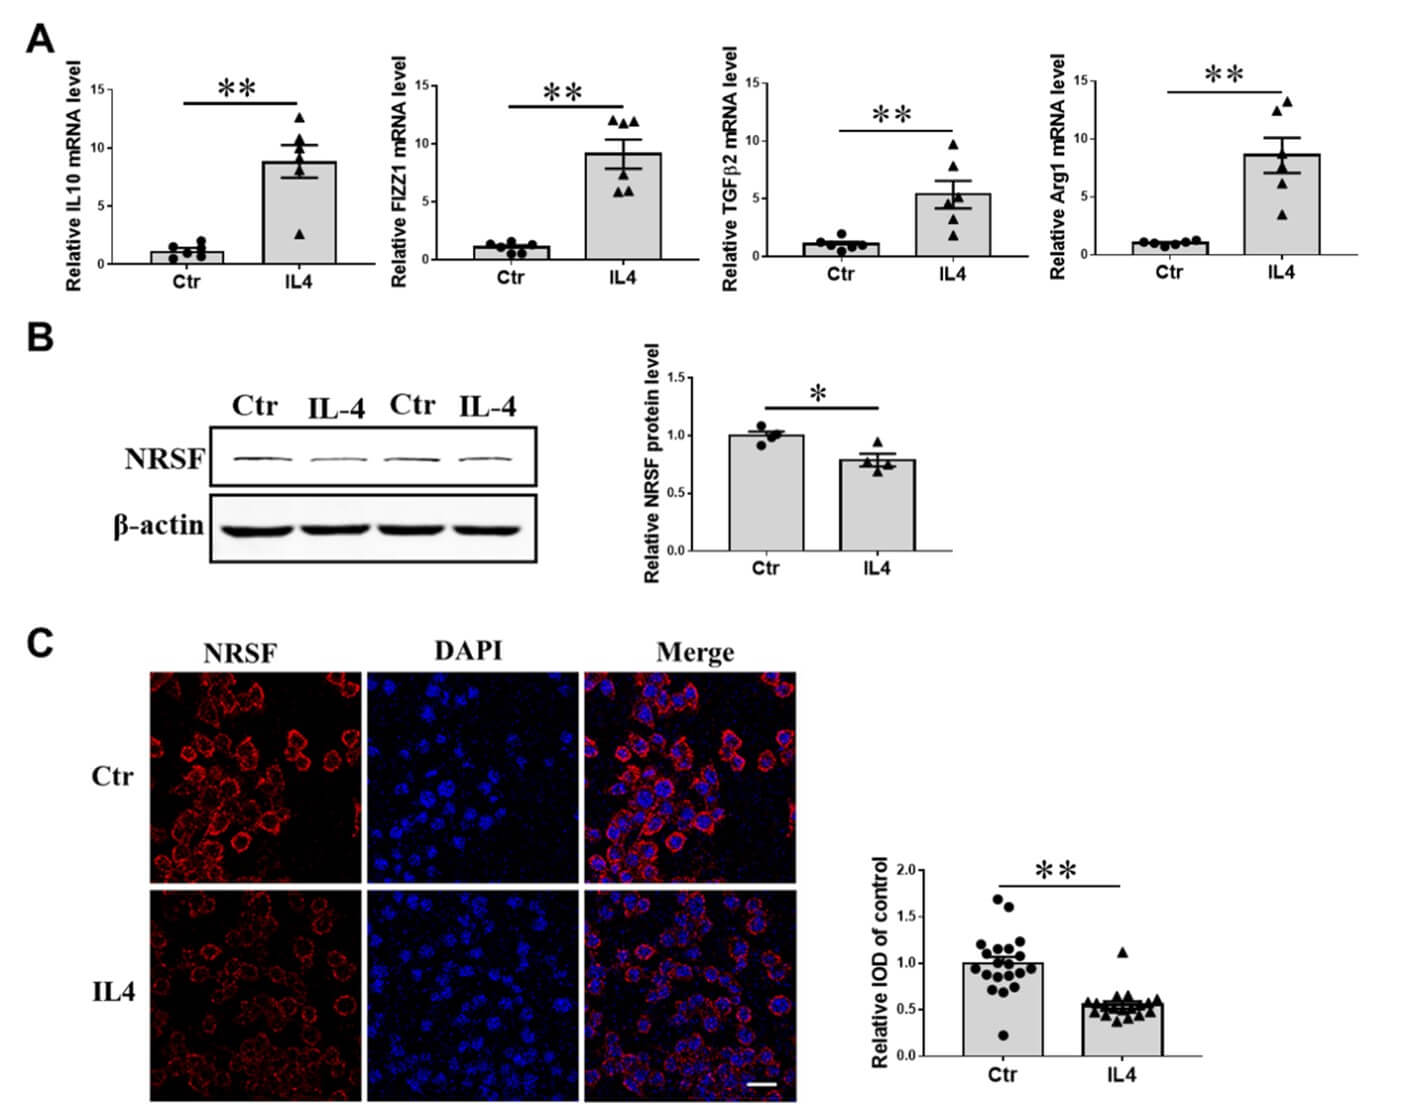
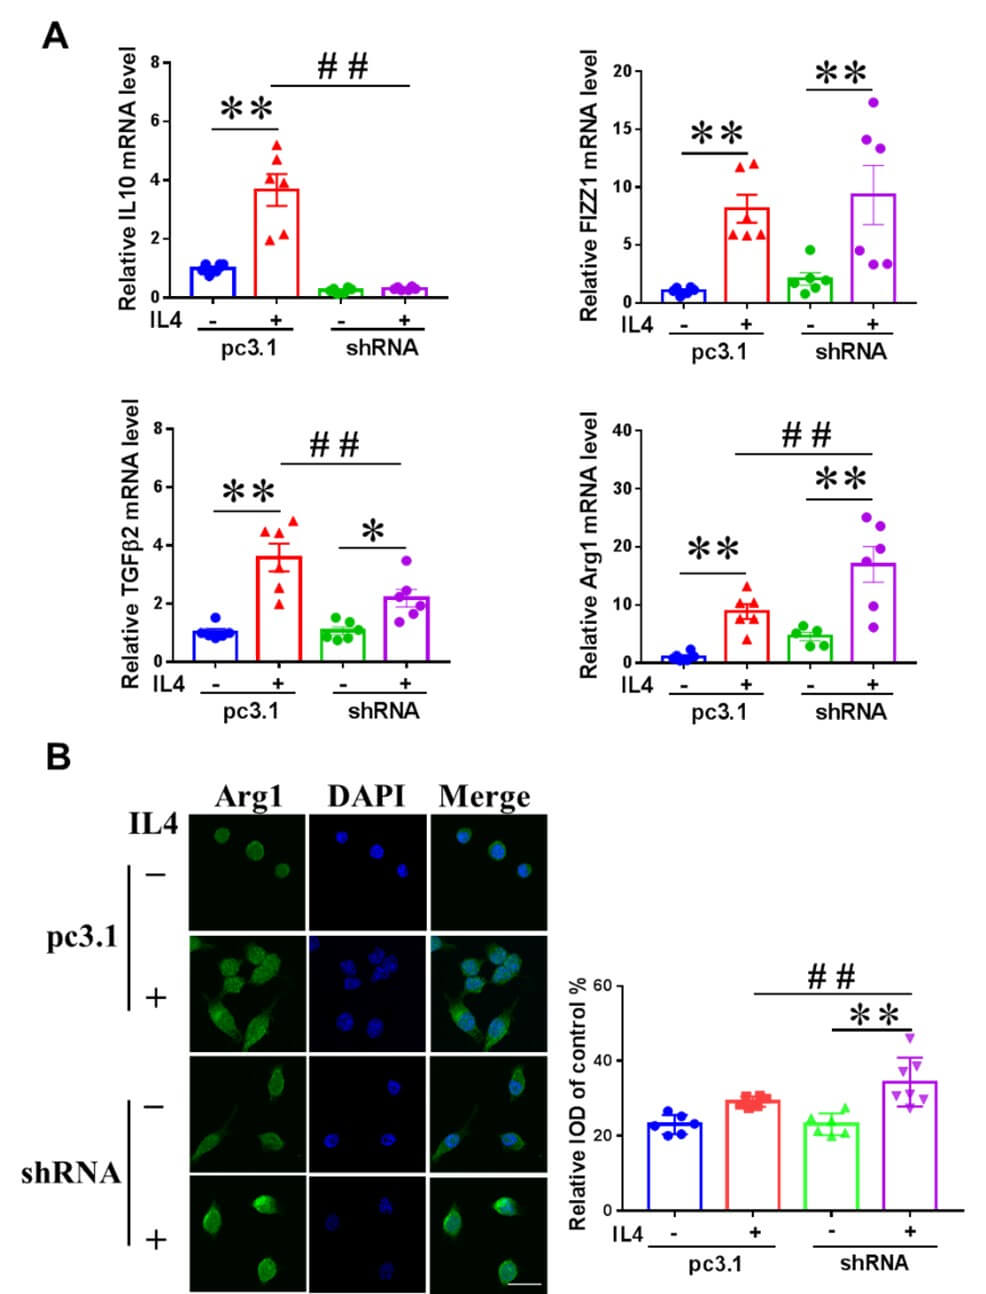
Parallel to the above description, we conducted qPCR to measure the mRNA expression levels of IL10, FIZZ1, TGFβ2, and Arg1 in BV2 cells following treatment with 10ng/ml IL4 for 24 hours. Exposure to IL4 resulted in a significant increase in the transcriptional expression of these genes, indicating that BV2 cells had been activated into an anti-inflammatory state (Figure 4A). We analyzed NRSF protein expression level by western blot in cells. As shown, compared with the control group, the protein expression of NRSF decreased significantly (Figure 4B). Further, immunofluorescence confocal imaging was performed to investigate the subcellular localization of NRSF in BV2 after the treatment of IL4 for 24h. We demonstrated that the fluorescence intensity of immune-labelled NRSF also declined, and there was no obvious nuclear translocation (Figure 4D).
3.5. Impact of NRSF Knockdown on the Reactivity of BV2 Cells to IL4 Challenge
In IL4-induced microglia, NRSF knockdown had differential effects on the mRNA expression of IL10, FIZZ1, TGFβ2 and Arg1 (Figure 5A). After IL4 treatment for 24h, IL10 and TGFβ2 mRNA expression decreased, while Arg1 mRNA expression increased, and FIZZ1 did not change in pcDNA3.1-shRNA BV2 cells compared with pcDNA3.1 BV2 cells, whereas all the four transcripts increased significantly in pcDNA3.1 BV2 cells (Figure 5A). Arg1 is the target gene of NRSF, we further confirmed the effect of NRSF knockdown on Arg1 expression in IL4 stimulated BV2 cells by immunofluorescence confocal analysis. As shown in (Figure 5B), NRSF knockdown significantly increased the fluorescence intensity of Arg1 in BV2 cells stimulated by IL4.
3.6. LPS Stimulation Increased Nuclear Localization of NRSF in Primary Microglia and Microglia in the Substantia Nigra of PD Mice
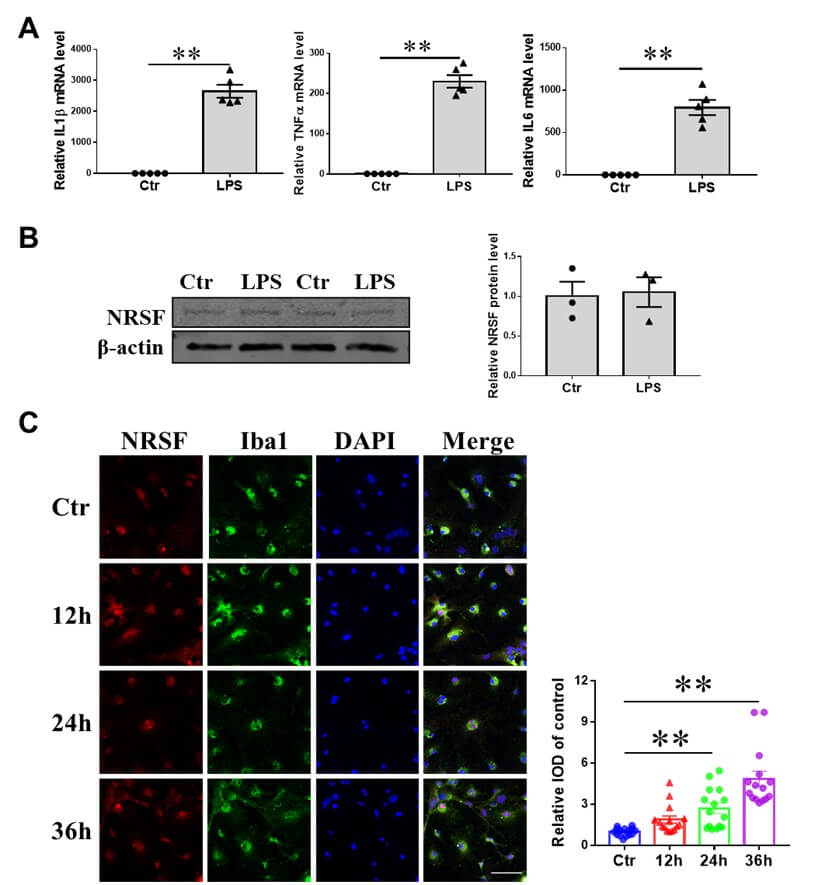
To investigate the alterations in NRSF expression and subcellular localization in primary microglia upon LPS stimulation, we isolated and cultured primary microglial cells from neonatal mice, subjecting them to treatment with 100 ng/ml LPS for various durations. Subsequently, we carried out qPCR, western blotting, and immunofluorescence confocal microscopy analyzes (Figure 6). Our data showed that a 6-hour LPS treatment significantly increased the mRNA expression levels of the pro-inflammatory factors IL1β, TNFα, and IL6 in the primary microglia (Figure 6A). Despite these changes, the overall protein levels of NRSF in the primary microglial cells remained relatively unchanged following LPS treatment (Figure 6B). However, after 24 or 36 hours of LPS incubation, there was a notable increase in the fluorescence signal for NRSF within the nuclei of the primary microglial cells, indicating a nuclear translocation of NRSF (Figure 6C). These observations align with the results obtained from BV2 cells treated with LPS.
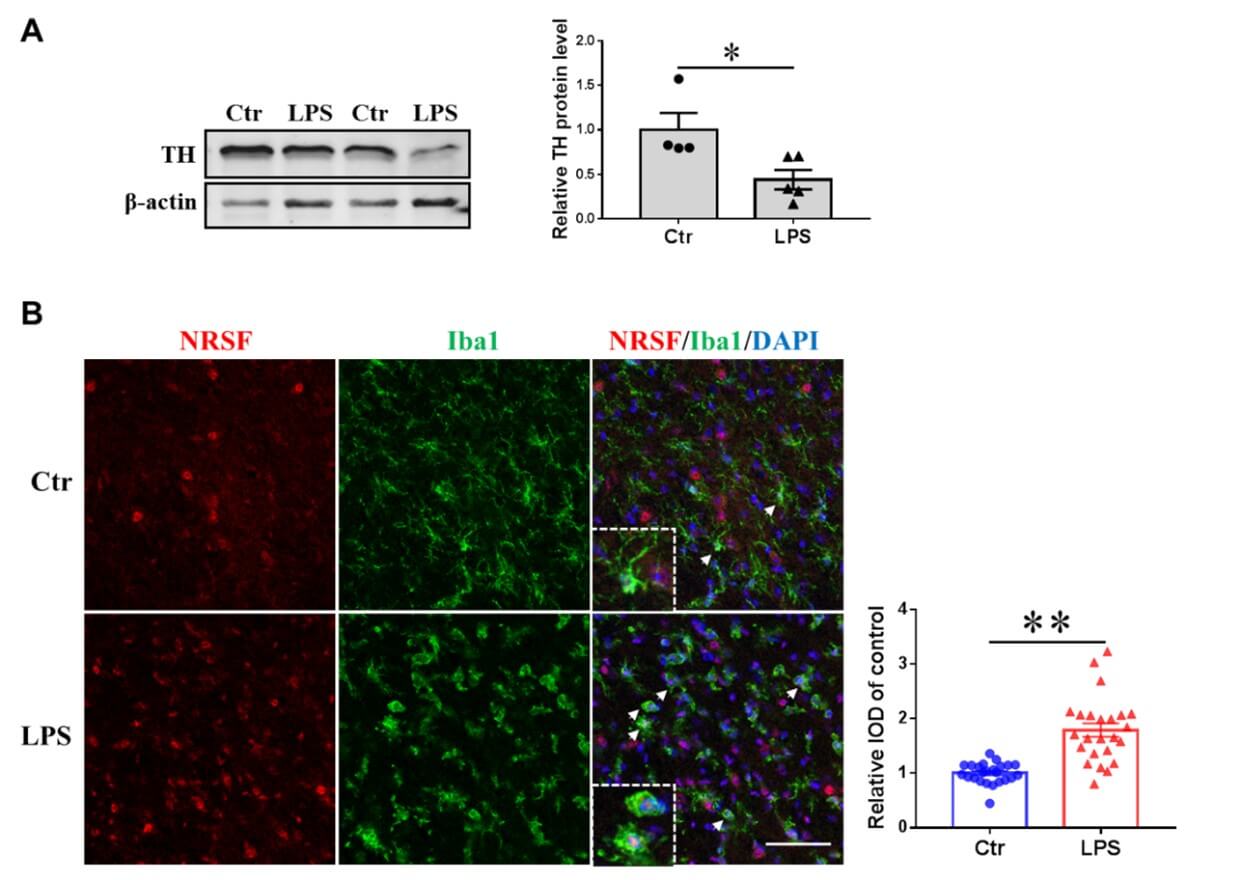
We were also interested in the subcellular localization of NRSF in activated microglia in PD animal models. Mouse substantia nigra were stereo-tactically injected with LPS (1µg in 0.5µl sterile saline) or 0.5µl sterile saline (as control). Western blot results showed that the expression level of TH protein (the rate-limiting enzyme of dopamine synthesis) in midbrain decreased significantly on the third day after LPS injection (Figure7A), suggesting that the establishment of PD animal model was successful. We used double immunofluorescence staining to label NRSF and microglia (labelled by Iba1) in the substantia nigra of this PD animal model (Figure 7B). Our confocal results showed that there were weak NRSF positive fluorescence signals in the nuclei of the Iba1 positive microglia in the substantia nigra of the control group. In the LPS-injection group, the Iba1 positive microglia in the substantia nigra showed an obvious activation morphology with relatively enlarged cell bodies, and there were strong NRSF positive fluorescence signals in the nuclei of these activated microglia (as indicated by the arrows). The statistical results also showed that compared with the control group, the fluorescence signal of NRSF in the nuclei of microglia in LPS group was significantly increased. This indicated that LPS stimulation also promoted NRSF nuclear distribution in microglia in vivo.
4. Discussion
Our previous study demonstrated that NRSF is an important regulator of neuronal survival in PD model in vivo and in vitro [7-10]. Meanwhile, Ohnuki et al. also observed the expression imbalance of NRSF and its target genes in the striatum of PD monkey model injured by MPTP [25]. Taken together, all the evidence indicates that NRSF-mediated target gene repression is an important mechanism in the development of PD [26].
Reactive microglia play an important role in neuroinflammation of PD [1, 2]. Most studies on the function of NRSF in the central nervous system focused on the regulation of NRSF on neuron, but NRSF modulates not only neuronal lineage but also glial lineage elaboration [12, 27]. In epileptic animal models, the synthesized miR-124 can effectively block the upregulation of NRSF, thus saving the target gene of NRSF, but also enhance the activation of microglia and inflammatory cytokines [28]. We speculate that NRSF might take part in the regulating of microglia activation.
As a transcription factor, NRSF binds to its target genes and regulates their transcription in the nucleus. Therefore, changes in NRSF expression or cell localization affect the neuronal survival in neurological diseases, for examples, the proposed neurotoxicity of elevated nuclear NRSF was detected in ischemia and Huntington’s disease [29-31]. On the contrary, the decreased nuclear NRSF in alzheimer’s disease and neuroprotection of NRSF in aging brain [32] were reported as well. NRSF deficiency leads to cellular senescence in primary neurons [33], and NRSF is activated by neuroinflammatory stimuli in both neuroblastoma cells and primary neurons [34]. In current study, we focused on the changes and regulatory role of NRSF in microglial activation. The results indicated that NRSF partially relocated to the nucleus in BV2 cells, primary mouse microglia, and microglia in the substantia nigra following LPS stimulation. Therefore, we reduced NRSF in nucleus by the method of shRNA and studied its effect of NRSF knockdown on the activation of microglia cells.
Target genes of NRSF are enriched in MAPK and NF-κB signalling pathways [12, 35]. Our results indicated that NRSF knockdown microglial cells displayed an increased pro-inflammatory state, potentially resulting from the enhanced activation of MAPK and NF-κB signalling pathways. Contrary to LPS stimulation, NRSF protein levels decreased in IL4-induced microglia. We attempted to overexpress NRSF in BV2 cells to assess its impact on the anti-inflammatory phenotype but encountered difficulties due to the large size of the NRSF cDNA (3249bp) and low transfection efficiency. Therefore, we examined the effects of NRSF knockdown on anti-inflammatory gene expression. NRSF knockdown induced inconsistent impact on the expression of anti-inflammatory gene (declined levels of IL10 and TGFβ2, unchanged FIZZ1, and increased level of Arg1). Among these genes, Arg1 is NRSF target genes [12]. However, the relationship of NRSF with IL10 and TGFβ2 is worth of further study. As NRSF can either repress or activate thousands of genes depending on cellular context, NRSF regulation is a complex network [3, 36-38]. NRSF knockdown might have diverse effects on different genes depending on whether they are a direct or indirect NRSF targets.
The degeneration of dopaminergic neurons in the substantia nigra of the midbrain and neuroinflammation mediated by activated microglia and astrocytes are the main pathological features of PD [1, 2]. We have reported the effect of NRSF on the survival of dopaminergic neurons in PD models [7, 9, 10]. The role of NRSF in astrocyte activation was also reported in our previous study [39]. Here, we found that NRSF is involved in modulating microglial activation. However, this study was mainly carried out by using in vitro cell model. To fully explain the roles of microglial NRSF in the pathogenesis of PD, researches on transgenic mice with conditional knockout or overexpression of NRSF in microglia are ongoing. An insight into the treatment of PD from the perspective of neuroinflammation warrants further studies.
5. Conclusion
NRSF is highly expressed in the nucleus of LPS-stimulated microglial cells, and it negatively regulates the expression and release of inflammatory cytokines in LPS-activated microglia. Conclusively, NRSF acts as a novel inhibitor of pro-inflammatory activation in microglia.
Author Contributions
Conceptualization: Mei Yu. Funding acquisition: Mei Yu. Investigation: Pengyu Wang, Binbin Li, Qiaoling Ruan, Jingzi ZhangBao, Lei Wu, Xiaoshuang Zhang and Zhaolin Liu. Supervision: Fang Huang. Writing - original draft: Mei Yu. Writing - review & editing: Fang Huang.
Funding
This work was supported by grants from the National Natural Science Foundation of China (81400992) and ZJLab.
Institutional Review Board Statement
The animal study protocol was approved by the Experimental Animal Ethics Committee of the School of Basic Medicine, Fudan University, China (protocol code 20190221-141).
Informed Consent Statement
Not applicable.
Data Availability Statement
Not applicable.
Conflicts of Interest
None.
REFERENCES
[1] Bruna Araújo, Rita Caridade-Silva, Carla
Soares-Guedes, et al. “Neuroinflammation and Parkinson's Disease-From
Neurodegeneration to Therapeutic Opportunities.” Cells, vol. 11, no. 18, pp. 2908, 2022. View
at: Publisher Site | PubMed
[2] Dongping Huang, Jing Xu, Jinghui Wang, et al.
“Dynamic Changes in the Nigrostriatal Pathway in the MPTP Mouse Model of
Parkinson's Disease.” Parkinsons Dis,
vol. 2017, pp. 9349487,
2017. View at: Publisher Site | PubMed
[3] Alexander W Bruce, Ian J Donaldson, Ian C Wood, et
al. “Genome-wide analysis of repressor element 1 silencing transcription
factor/neuron-restrictive silencing factor (REST/NRSF) target genes.” Proc Natl Acad Sci USA, vol. 101, no. 28, pp. 10458-10463,
2004. View at: Publisher Site | PubMed
[4] Joseph J Abrajano, Irfan A Qureshi, Solen Gokhan, et
al. “REST and CoREST modulate neuronal subtype specification, maturation and
maintenance.” PLoS One, vol. 4, no. 12, pp. e7936, 2009.
View at: Publisher Site | PubMed
[5] Luigi Formisano, Kyung-Min Noh, Takahiro Miyawaki,
et al. Ischemic insults promote epigenetic reprogramming of mu opioid receptor
expression in hippocampal neurons.” Proc
Natl Acad Sci USA, vol.
104, no. 10, pp. 4170-4175, 2007. View at: Publisher Site | PubMed
[6] Paola Conforti, Chiara Zuccato, Germano Gaudenzi, et
al. “Binding of the repressor complex REST-mSIN3b by small molecules restores
neuronal gene transcription in Huntington's disease models.” J Neurochem, vol. 127, no. 1, pp. 22-35, 2013. View at: Publisher Site | PubMed
[7] Mei Yu, Haiyun Suo, Ming Liu, et al. “NRSF/REST
neuronal deficient mice are more vulnerable to the neurotoxin MPTP.” Neurobiol Aging, vol. 34, no. 3, pp. 916-927, 2013. View at: Publisher Site | PubMed
[8] Mei Yu, Lei Cai, Min Liang, et al. “Alteration of
NRSF expression exacerbating 1-methyl-4-phenyl-pyridinium ion-induced cell
death of SH-SY5Y cells.” Neurosci Res, vol. 65, no. 3, pp. 236-244, 2009.
View at: Publisher Site | PubMed
[9] Haiyun Suo, Pan Wang, Jiabin Tong, et al. “NRSF is
an essential mediator for the neuroprotection of trichostatin A in the MPTP
mouse model of Parkinson's disease.” Neuropharmacology, vol. 99, pp. 67-78, 2015. View at: Publisher Site | PubMed
[10] Dongping Huang, Qing Li, Yi Wang, et al.
“Brain-specific NRSF deficiency aggravates dopaminergic neurodegeneration and
impairs neurogenesis in the MPTP mouse model of Parkinson's disease.” Aging (Albany NY), vol. 11, no. 10, pp. 3280-3297, 2019. View at: Publisher Site | PubMed
[11] Miwako Kawamura, Shigeto Sato, Gen Matsumoto, et al.
“Loss of nuclear REST/NRSF in aged-dopaminergic neurons in Parkinson's disease
patients.” Neurosci Lett, vol. 699, pp. 59-63, 2019. View at:
Publisher Site | PubMed
[12] Joseph J Abrajano, Irfan A Qureshi, Solen Gokhan, et
al. “Differential deployment of REST and CoREST promotes glial subtype
specification and oligodendrocyte lineage maturation.” PLoS One, vol. 4,
no. 11, pp. e7665, 2009. View at: Publisher Site | PubMed
[13] Ilaria Prada, Julie Marchaland, Paola Podini, et al.
“REST/NRSF governs the expression of dense-core vesicle gliosecretion in
astrocytes.” J Cell Biol, vol. 193, no. 3, pp. 537-549, 2011.
View at: Publisher Site | PubMed
[14] Suraj Pradhan, Katrin Andreasson “Commentary:
Progressive inflammation as a contributing factor to early development of
Parkinson's disease.” Exp Neurol, vol. 241, pp. 148-155, 2013. View
at: Publisher Site | PubMed
[15] David P Stirling, Karen Cummins, Manoj Mishra, et
al. “Toll-like receptor 2-mediated alternative activation of microglia is
protective after spinal cord injury.” Brain, vol. 137, no. Pt 3, pp. 707-723,
2014. View at: Publisher Site | PubMed
[16] Fabio Blandini “Neural and immune mechanisms in the
pathogenesis of Parkinson's disease.” J
Neuroimmune Pharmacol, vol.
8, no. 1, pp. 189-201, 2013. View at: Publisher Site | PubMed
[17] Yu Tang, Weidong Le “Differential Roles of M1 and M2
Microglia in Neurodegenerative Diseases.” Mol Neurobiol, vol. 53, no. 2,
pp. 1181-1194, 2016. View at: Publisher Site | PubMed
[18] D Boche, V H Perry, J A R Nicoll “Review: activation
patterns of microglia and their identification in the human brain.” Neuropathol Appl Neurobiol, vol. 39, no. 1, pp. 3-18, 2013.
View at: Publisher Site | PubMed
[19] Jialin Zheng, Xinjin Zhang, Wenfeng Cai, et al.
“Bone Marrow Mesenchymal Stem Cell-Derived Exosomal microRNA-29b-3p Promotes
Angiogenesis and Ventricular Remodeling in Rats with Myocardial Infarction by
Targeting ADAMTS16.” Cardiovasc Toxicol,
vol. 22, no. 8, pp. 689-700, 2022. View at: Publisher Site | PubMed
[20] Yuan Xu, Feng Zhi, Ya Peng, et al. “A Critical Role
of delta-Opioid Receptor in Anti-microglial Activation Under Stress.” Front Aging Neurosci, vol. 14, pp. 847386, 2022. View at:
Publisher Site | PubMed
[21] Fei Chen, Minwei Hu, Yue Shen, et al. “Isorhamnetin
promotes functional recovery in rats with spinal cord injury by abating
oxidative stress and modulating M2 macrophages/microglia polarization.” Eur J Pharmacol, vol. 895, pp. 173878,
2021. View at: Publisher Site | PubMed
[22] Tao Gaojian, Qian Dingfei, Li Linwei, et al.
“Parthenolide promotes the repair of spinal cord injury by modulating M1/M2
polarization via the NF-kappaB and STAT 1/3 signaling pathway.” Cell Death Discov, vol. 6, pp. 97, 2020. View at: Publisher Site | PubMed
[23] Josep Saura, Josep Maria Tusell, Joan Serratosa
“High-yield isolation of murine microglia by mild trypsinization.” Glia, vol. 44, no. 3, pp. 183-189, 2003. View at: Publisher Site | PubMed
[24] Jae-Kyung Lee, Jaegwon Chung, George T Kannarkat, et
al. “Critical role of regulator G-protein signaling 10 (RGS10) in modulating
macrophage M1/M2 activation.” PLoS One, vol. 8, no. 11, pp. e81785, 2013.
View at: Publisher Site | PubMed
[25] Tatsuya Ohnuki 1, Atsushi Nakamura, Shigeru Okuyama,
et al. “Gene expression profiling in progressively MPTP-lesioned macaques
reveals molecular pathways associated with sporadic Parkinson's disease.” Brain Res, vol. 1346, pp. 26-42, 2010. View at: Publisher Site | PubMed
[26] Xin-Jin Su, Bei-Duo Shen, Kun Wang, et al. Roles of
the Neuron-Restrictive Silencer Factor in the Pathophysiological Process of the
Central Nervous System. Front Cell Dev Biol, vol. 10, pp. 834620, 2022. View at:
Publisher Site | PubMed
[27] Maria Bergsland, Ruxandra Covacu, Cynthia Perez
Estrada, et al. “Nitric oxide-induced neuronal to glial lineage fate-change
depends on NRSF/REST function in neural progenitor cells.” Stem Cells, vol.
32, no. 9, pp. 2539-2549, 2014. View at: Publisher Site | PubMed
[28] Gary P Brennan, Deblina Dey, Yuncai Chen, et al.
“Dual and Opposing Roles of MicroRNA-124 in Epilepsy Are Mediated through
Inflammatory and NRSF-Dependent Gene Networks.” Cell Rep, vol. 14,
no. 10, pp. 2402-2412, 2016. View at: Publisher Site | PubMed
[29] Chiara Zuccato, Marzia Tartari, Andrea Crotti, et
al. “Huntingtin interacts with REST/NRSF to modulate the transcription of
NRSE-controlled neuronal genes.” Nat
Genet, vol. 35, no. 1, pp.
76-83, 2003. View at: Publisher Site | PubMed
[30] Noel J Buckley, Rory Johnson, Chiara Zuccato, et al.
“The role of REST in transcriptional and epigenetic dysregulation in
Huntington's disease.” Neurobiol Dis, vol. 39, no. 1, pp. 28-39, 2010.
View at: Publisher Site | PubMed
[31] Ryan Thompson, Christina Chan “NRSF and Its
Epigenetic Effectors: New Treatments for Neurological Disease.” Brain Sci, vol. 8, no. 12, pp.
226, 2018. View at: Publisher Site | PubMed
[32] Tao Lu, Liviu Aron, Joseph Zullo, et al. “REST and
stress resistance in ageing and Alzheimer's disease.” Nature, vol. 507, no. 7493, pp. 448-454, 2014.
View at: Publisher Site | PubMed
[33] Anna Rocchi, Emanuele Carminati, Antonio De Fusco,
et al. “REST/NRSF deficiency impairs autophagy and leads to cellular senescence
in neurons.” Aging Cell,
vol. 20, no. 10, pp. e13471, 2021. View at: Publisher Site | PubMed
[34] Federica Buffolo, Valentina Petrosino, Martina
Albini, et al. “Neuroinflammation induces synaptic scaling through IL-1beta-mediated
activation of the transcriptional repressor REST/NRSF.” Cell Death Dis,
vol. 12, no. 2, pp. 180, 2021. View at: Publisher Site | PubMed
[35] Kaushali Thakore-Shah, Tasneem Koleilat, Majib Jan,
et al. “REST/NRSF Knockdown Alters Survival, Lineage Differentiation and
Signaling in Human Embryonic Stem Cells.” PLoS
One, vol. 10, no. 12, pp.
e0145280, 2015. View at: Publisher Site | PubMed
[36] Guo-Lin Chen, Gregory M Miller “Alternative REST
Splicing Underappreciated.” eNeuro, vol. 5, no. 5, 2018. View at: Publisher Site | PubMed
[37] Yangang Zhao, Min Zhu, Yanlan Yu, et al. “Brain
REST/NRSF Is Not Only a Silent Repressor but Also an Active Protector.” Mol Neurobiol, vol. 54, no. 1, pp. 541-550, 2017. View at: Publisher Site | PubMed
[38] Zhiqi Song, Deming Zhao, Huajia Zhao, et al. “NRSF: an angel or a devil in neurogenesis and neurological diseases.” J Mol Neurosci, vol. 56, no. 1, pp. 131-144, 2015. View at: Publisher Site | PubMed
[39] Heng Li 1, Zhaolin Liu, Yufei Wu, et al. “The deficiency of NRSF/REST enhances the pro-inflammatory function of astrocytes in a model of Parkinson's disease.” Biochim Biophys Acta Mol Basis Dis, vol. 1866, no. 1, pp. 165590, 2020. View at: Publisher Site | PubMed